
- Home >
- Stock Photos >
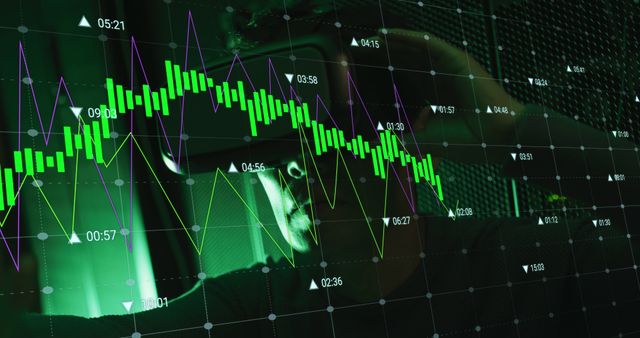
- Dynamic Financial Data Projection in Modern Office Environment
Dynamic Financial Data Projection in Modern Office Environment Image

This scene depicts financial data graphs and charts overlaying a contemporary office space, conveying the concept of dynamic, real-time data processing and analysis in a modern business setting. This could be useful in presentations or articles about global finance, investment trends, economic analysis, or the intersection of business and technology.
Powered by  - Get 15% off with code: PIKWIZARD15


2
downloads
downloads
Tags:
More
Credit Photo
If you would like to credit the Photo, here are some ways you can do so
Text Link
photo Link
<span class="text-link">
<span>
<a target="_blank" href=https://pikwizard.com/photo/dynamic-financial-data-projection-in-modern-office-environment/0301fb0edde3d2c70dd8d6e86f9ea42f/>PikWizard</a>
</span>
</span>
<span class="image-link">
<span
style="margin: 0 0 20px 0; display: inline-block; vertical-align: middle; width: 100%;"
>
<a
target="_blank"
href="https://pikwizard.com/photo/dynamic-financial-data-projection-in-modern-office-environment/0301fb0edde3d2c70dd8d6e86f9ea42f/"
style="text-decoration: none; font-size: 10px; margin: 0;"
>
<img src="https://pikwizard.com/pw/medium/0301fb0edde3d2c70dd8d6e86f9ea42f.jpg" style="margin: 0; width: 100%;" alt="" />
<p style="font-size: 12px; margin: 0;">PikWizard</p>
</a>
</span>
</span>
Free (free of charge)
Free for personal and commercial use.
Author: Authentic Images
Similar Free Stock Images

Premium


Premium


Premium


Premium


Premium


Premium


Premium


Premium


Premium


Premium


Premium


Premium


Premium


Premium


Premium


Premium


Premium


Premium


Premium


Premium


Premium


Premium


Premium


Premium


Premium

