- Home >
- Stock Photos >
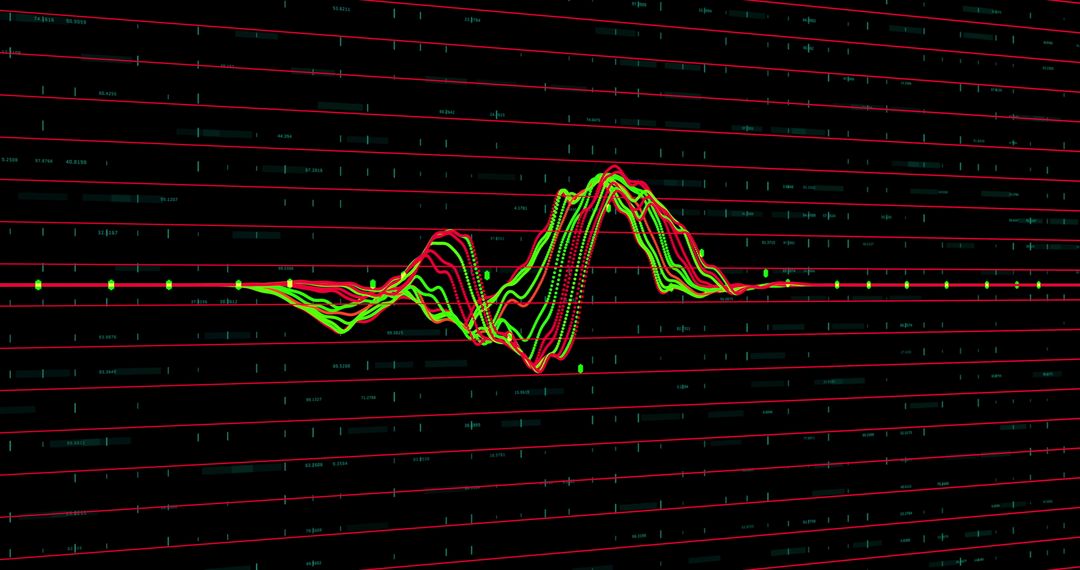
- Dynamic Financial Data Representation in Red with Arrow Indicators
Dynamic Financial Data Representation in Red with Arrow Indicators Image

This visual conveys a concept of fluctuating stock markets or economic indicators, showcasing digital financial data represented in red with arrows indicating market trends. Ideal for publications and websites focusing on finance, business analytics, market forecasts, and economic strategies. The engaging and dynamic styling highlights concepts of growth, decline, and market volatility.
Powered by 


2
downloads
downloads
Tags:
More
Credit Photo
If you would like to credit the Photo, here are some ways you can do so
Text Link
photo Link
<span class="text-link">
<span>
<a target="_blank" href=https://pikwizard.com/photo/dynamic-financial-data-representation-in-red-with-arrow-indicators/18f39751e269eaf1af657a57c4a1733d/>PikWizard</a>
</span>
</span>
<span class="image-link">
<span
style="margin: 0 0 20px 0; display: inline-block; vertical-align: middle; width: 100%;"
>
<a
target="_blank"
href="https://pikwizard.com/photo/dynamic-financial-data-representation-in-red-with-arrow-indicators/18f39751e269eaf1af657a57c4a1733d/"
style="text-decoration: none; font-size: 10px; margin: 0;"
>
<img src="https://pikwizard.com/pw/medium/18f39751e269eaf1af657a57c4a1733d.jpg" style="margin: 0; width: 100%;" alt="" />
<p style="font-size: 12px; margin: 0;">PikWizard</p>
</a>
</span>
</span>
Free (free of charge)
Free for personal and commercial use.
Author: Awesome Content
Similar Free Stock Images
Premium


Premium


Premium


Premium


Premium


Premium


Premium


Premium


Premium


Premium


Premium


Premium


Premium


Premium


Premium


Premium


Premium


Premium


Premium


Premium


Premium


Premium


Premium


Premium