- Home >
- Stock Photos >
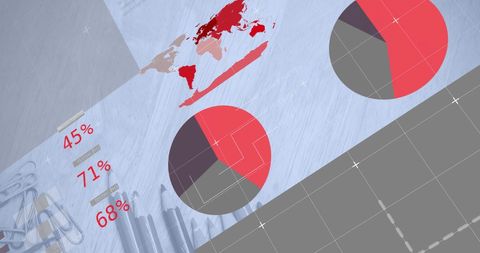
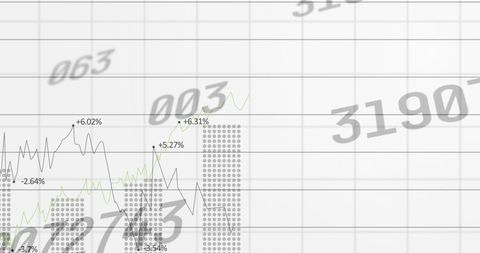
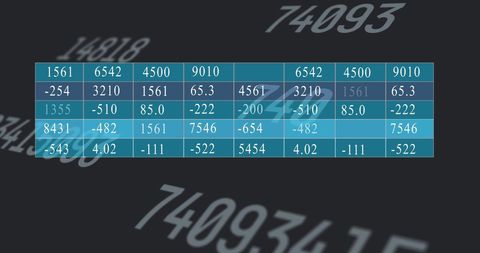
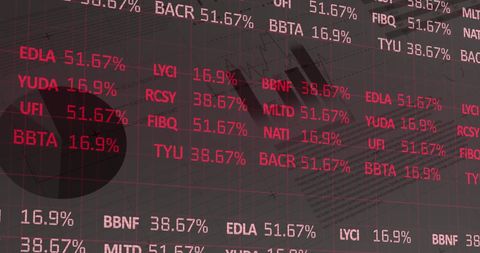
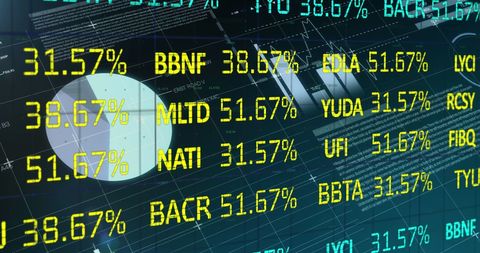
- Dynamic Financial Data Spread with Graphs and Charts
Dynamic Financial Data Spread with Graphs and Charts Image

Abstract illustration highlighting comprehensive financial data analysis. Numbers, graphs, and charts visually depict metric evaluations and statistics. Perfect for business presentations, data visualization projects, and reports showcasing financial forecasts and performance analytics.

downloads
Tags:
More
Credit Photo
If you would like to credit the Photo, here are some ways you can do so
Text Link
photo Link
<span class="text-link">
<span>
<a target="_blank" href=https://pikwizard.com/photo/dynamic-financial-data-spread-with-graphs-and-charts/ab779930e30fb092aebf40f6b324347d/>PikWizard</a>
</span>
</span>
<span class="image-link">
<span
style="margin: 0 0 20px 0; display: inline-block; vertical-align: middle; width: 100%;"
>
<a
target="_blank"
href="https://pikwizard.com/photo/dynamic-financial-data-spread-with-graphs-and-charts/ab779930e30fb092aebf40f6b324347d/"
style="text-decoration: none; font-size: 10px; margin: 0;"
>
<img src="https://pikwizard.com/pw/medium/ab779930e30fb092aebf40f6b324347d.jpg" style="margin: 0; width: 100%;" alt="" />
<p style="font-size: 12px; margin: 0;">PikWizard</p>
</a>
</span>
</span>
Free (free of charge)
Free for personal and commercial use.
Author: People Creations