
- Home >
- Stock Photos >
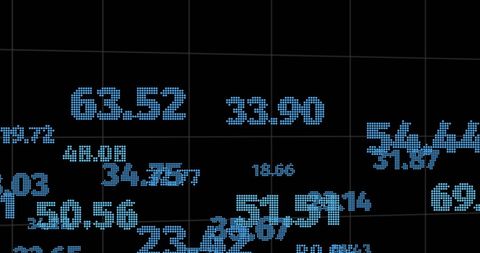
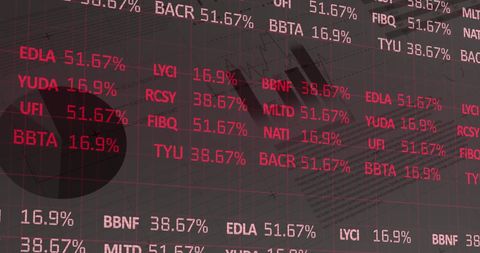
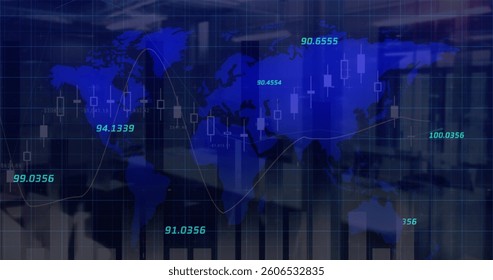
- Dynamic Financial Data Stream Visualization in Network Grid
Dynamic Financial Data Stream Visualization in Network Grid Image

Represents dynamic flow of global financial data with numbers and currency symbols intersecting in a network grid pattern. Suitable for illustrating articles about technology in finance, explaining modern data analytics in business, or designing company presentations on digital banking advancements. Highlights interconnectedness of global economies for educational visuals.
Powered by  - Get 15% off with code: PIKWIZARD15


downloads
Tags:
More
Credit Photo
If you would like to credit the Photo, here are some ways you can do so
Text Link
photo Link
<span class="text-link">
<span>
<a target="_blank" href=https://pikwizard.com/photo/dynamic-financial-data-stream-visualization-in-network-grid/c2f95b5b1db642dd4684167e783e463c/>PikWizard</a>
</span>
</span>
<span class="image-link">
<span
style="margin: 0 0 20px 0; display: inline-block; vertical-align: middle; width: 100%;"
>
<a
target="_blank"
href="https://pikwizard.com/photo/dynamic-financial-data-stream-visualization-in-network-grid/c2f95b5b1db642dd4684167e783e463c/"
style="text-decoration: none; font-size: 10px; margin: 0;"
>
<img src="https://pikwizard.com/pw/medium/c2f95b5b1db642dd4684167e783e463c.jpg" style="margin: 0; width: 100%;" alt="" />
<p style="font-size: 12px; margin: 0;">PikWizard</p>
</a>
</span>
</span>
Free (free of charge)
Free for personal and commercial use.
Author: Awesome Content
Similar Free Stock Images

Premium


Premium

Premium


Premium


Premium


Premium


Premium

Premium

Premium

Premium


Premium


Premium


Premium


Premium


Premium


Premium


Premium


Premium

Premium


Premium

Premium


Premium


Premium

Premium


Premium


Explore More Free Stock Images