
- Home >
- Stock Photos >
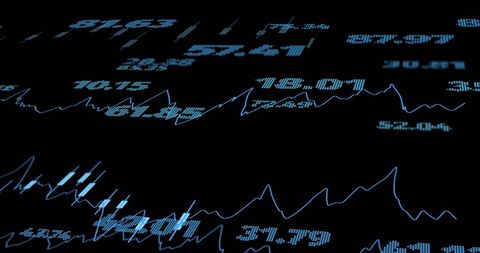
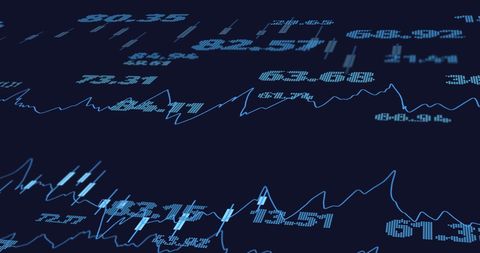
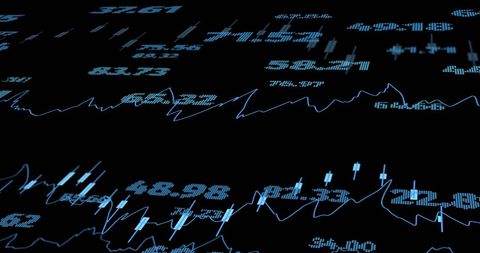
- Dynamic Financial Data Streams and Global Networks
Dynamic Financial Data Streams and Global Networks Image

Abstract visual of dynamic financial numbers and graphs displaying on dark digital background. Ideal for illustrating topics related to finance, trading, global market trends, economic presentations, and data analysis in business settings. Use in financial reports, investment guides, or technology-centered discussions about digital intelligence.
Powered by 


downloads
Tags:
More
Credit Photo
If you would like to credit the Photo, here are some ways you can do so
Text Link
photo Link
<span class="text-link">
<span>
<a target="_blank" href=https://pikwizard.com/photo/dynamic-financial-data-streams-and-global-networks/0e65fb11b252a72f85b89da7ca8e31fe/>PikWizard</a>
</span>
</span>
<span class="image-link">
<span
style="margin: 0 0 20px 0; display: inline-block; vertical-align: middle; width: 100%;"
>
<a
target="_blank"
href="https://pikwizard.com/photo/dynamic-financial-data-streams-and-global-networks/0e65fb11b252a72f85b89da7ca8e31fe/"
style="text-decoration: none; font-size: 10px; margin: 0;"
>
<img src="https://pikwizard.com/pw/medium/0e65fb11b252a72f85b89da7ca8e31fe.jpg" style="margin: 0; width: 100%;" alt="" />
<p style="font-size: 12px; margin: 0;">PikWizard</p>
</a>
</span>
</span>
Free (free of charge)
Free for personal and commercial use.
Author: Authentic Images
Similar Free Stock Images

Premium


Premium


Premium


Premium


Premium


Premium

Premium


Premium


Premium


Premium


Premium


Premium


Premium

Premium

Premium


Premium


Premium


Premium


Premium


Premium


Premium


Premium


Premium


Premium

Premium


Explore More Free Stock Images