- Home >
- Stock Photos >
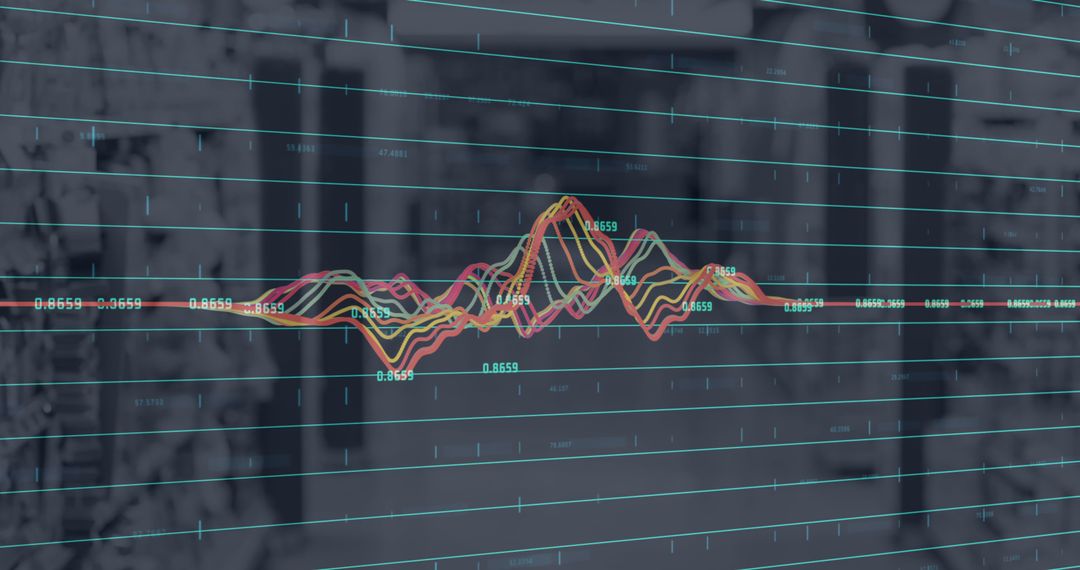
- Dynamic Financial Data Streams for Market Analysis
Dynamic Financial Data Streams for Market Analysis Image

Abstract depiction of financial data processing suitable for use in financial market, business analysis, or technology themed content. Ideal for illustrating complex market patterns, data-centered concepts in startups, finance industries, or academic presentations about market trends and analytics. Visually appealing for adding depth to financial district resource graphics or company reports on market monitoring mechanisms.
Powered by  - Get 15% off with code: PIKWIZARD15


2
downloads
downloads
Tags:
More
Credit Photo
If you would like to credit the Photo, here are some ways you can do so
Text Link
photo Link
<span class="text-link">
<span>
<a target="_blank" href=https://pikwizard.com/photo/dynamic-financial-data-streams-for-market-analysis/2aec964693b97068e3f1c07722b1cc2e/>PikWizard</a>
</span>
</span>
<span class="image-link">
<span
style="margin: 0 0 20px 0; display: inline-block; vertical-align: middle; width: 100%;"
>
<a
target="_blank"
href="https://pikwizard.com/photo/dynamic-financial-data-streams-for-market-analysis/2aec964693b97068e3f1c07722b1cc2e/"
style="text-decoration: none; font-size: 10px; margin: 0;"
>
<img src="https://pikwizard.com/pw/medium/2aec964693b97068e3f1c07722b1cc2e.jpg" style="margin: 0; width: 100%;" alt="" />
<p style="font-size: 12px; margin: 0;">PikWizard</p>
</a>
</span>
</span>
Free (free of charge)
Free for personal and commercial use.
Author: Authentic Images
Similar Free Stock Images

Premium


Premium


Premium


Premium


Premium


Premium


Premium


Premium


Premium


Premium


Premium


Premium


Premium


Premium


Premium


Premium


Premium


Premium


Premium


Premium


Premium


Premium


Premium


Premium