- Home >
- Stock Photos >
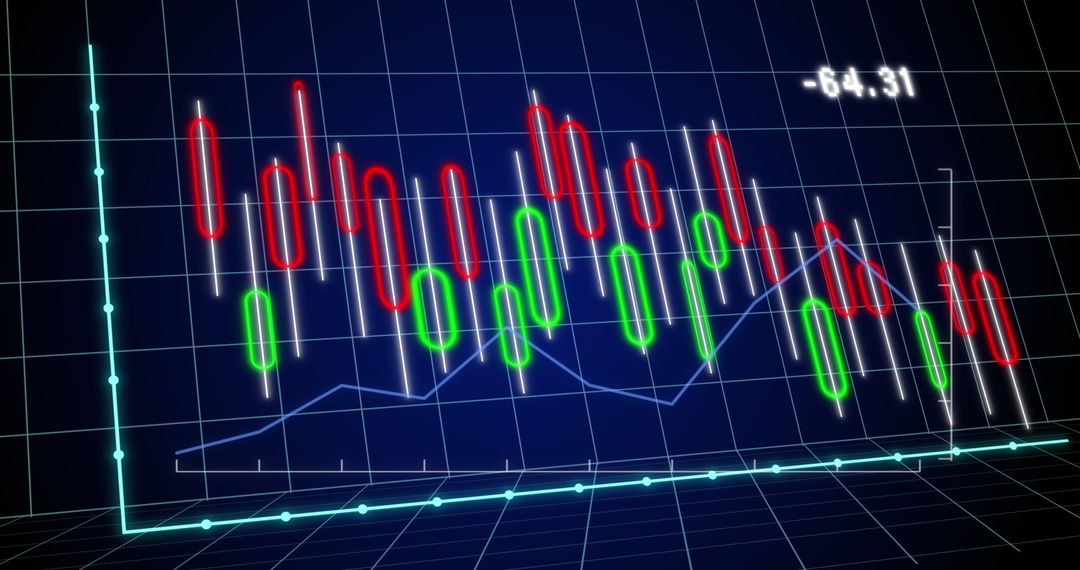
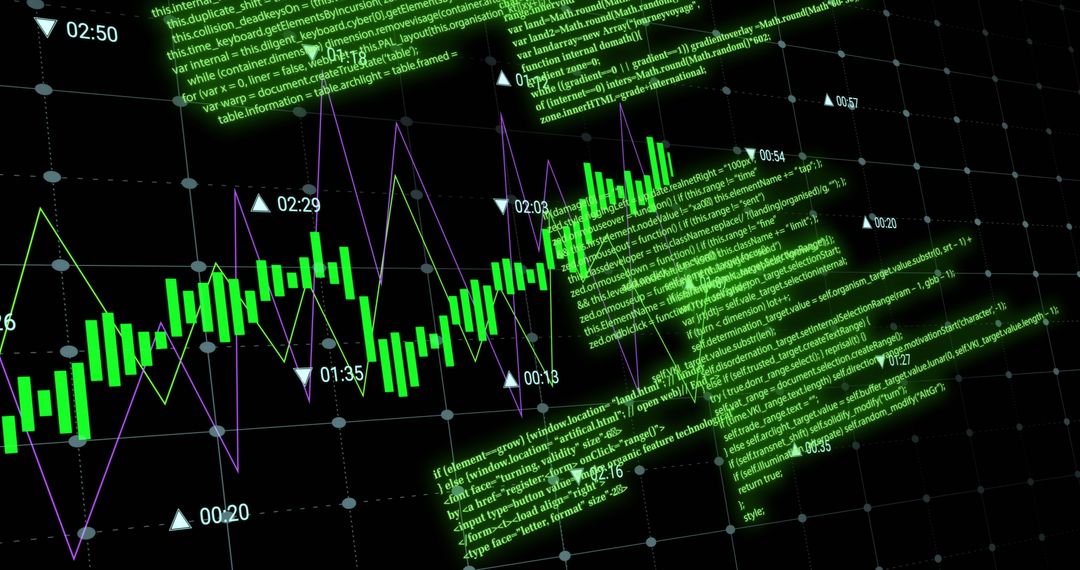
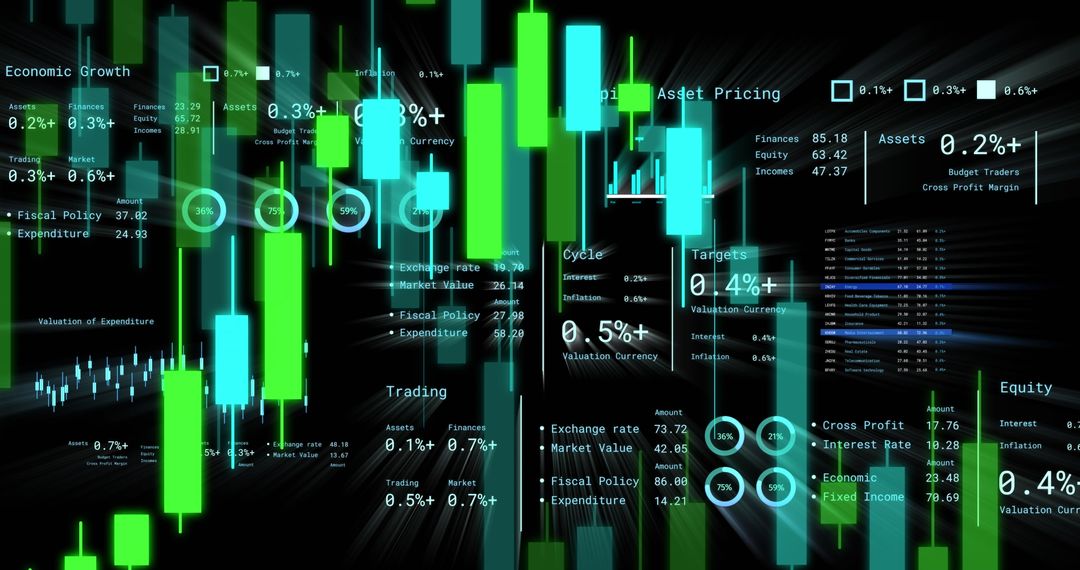
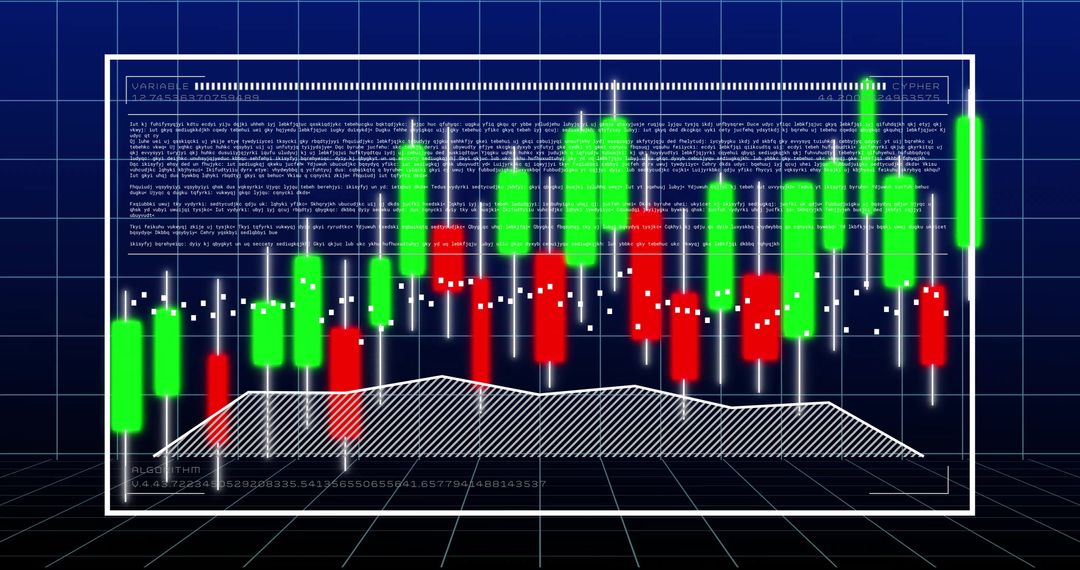
- Dynamic Financial Data Tracking with Charts and Graphs
Dynamic Financial Data Tracking with Charts and Graphs Image
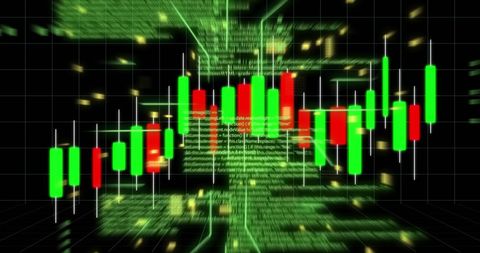
Depiction of fast-paced financial analysis with vibrant green and red digital graph representing stock market trends. This is ideal for blogs about trading strategies, financial news websites, or presentations on stock data analysis. It visually emphasizes the volatility and dynamics of market changes in a tech-driven environment.
Powered by  - Get 15% off with code: PIKWIZARD15


2
downloads
downloads
Tags:
More
Credit Photo
If you would like to credit the Photo, here are some ways you can do so
Text Link
photo Link
<span class="text-link">
<span>
<a target="_blank" href=https://pikwizard.com/photo/dynamic-financial-data-tracking-with-charts-and-graphs/035e7eb8c49b75510826eca654a5c050/>PikWizard</a>
</span>
</span>
<span class="image-link">
<span
style="margin: 0 0 20px 0; display: inline-block; vertical-align: middle; width: 100%;"
>
<a
target="_blank"
href="https://pikwizard.com/photo/dynamic-financial-data-tracking-with-charts-and-graphs/035e7eb8c49b75510826eca654a5c050/"
style="text-decoration: none; font-size: 10px; margin: 0;"
>
<img src="https://pikwizard.com/pw/medium/035e7eb8c49b75510826eca654a5c050.jpg" style="margin: 0; width: 100%;" alt="" />
<p style="font-size: 12px; margin: 0;">PikWizard</p>
</a>
</span>
</span>
Free (free of charge)
Free for personal and commercial use.
Author: Awesome Content
Similar Free Stock Images

Premium


Premium


Premium


Premium


Premium


Premium


Premium


Premium


Premium


Premium


Premium


Premium


Premium


Premium


Premium


Premium


Premium


Premium


Premium


Premium


Premium


Premium


Premium


Premium