- Home >
- Stock Photos >
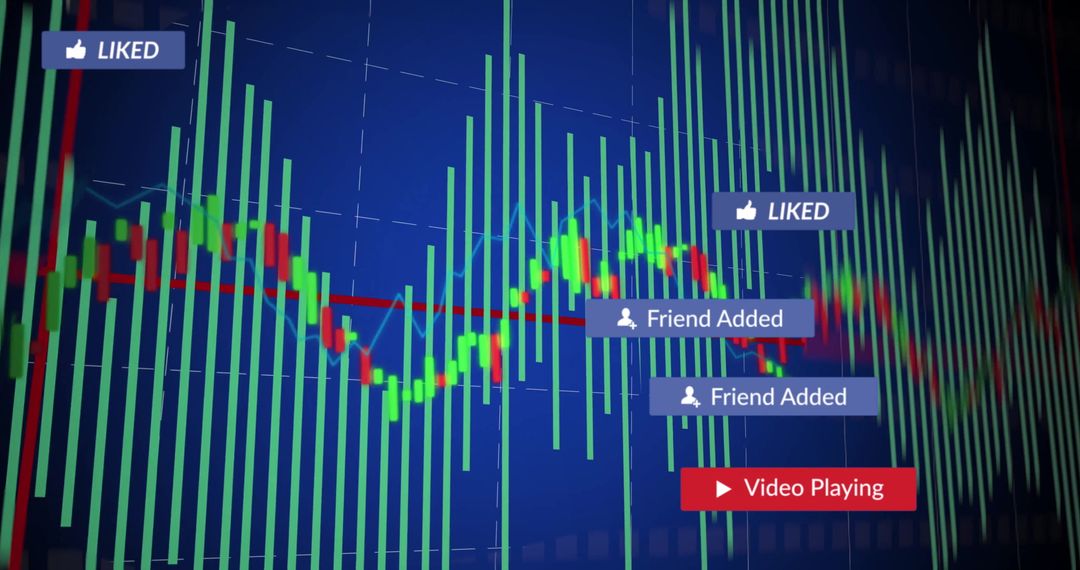
- Dynamic Financial Data View with Stock Market Trends and Graphs
Dynamic Financial Data View with Stock Market Trends and Graphs Image

The visualization presents dynamic financial data over a blue background with prominent stock market graphs and trends highlighting years such as 2006 and 2020. This can be utilized for presentations on financial growth, investment strategies, and market volatility. Ideal for bloggers, economic analysts, and financial consultants to illustrate stock market discussions.
Powered by  - Get 15% off with code: PIKWIZARD15


2
downloads
downloads
Tags:
More
Credit Photo
If you would like to credit the Photo, here are some ways you can do so
Text Link
photo Link
<span class="text-link">
<span>
<a target="_blank" href=https://pikwizard.com/photo/dynamic-financial-data-view-with-stock-market-trends-and-graphs/74fc936fd6d25097cd2986b39b2f27c7/>PikWizard</a>
</span>
</span>
<span class="image-link">
<span
style="margin: 0 0 20px 0; display: inline-block; vertical-align: middle; width: 100%;"
>
<a
target="_blank"
href="https://pikwizard.com/photo/dynamic-financial-data-view-with-stock-market-trends-and-graphs/74fc936fd6d25097cd2986b39b2f27c7/"
style="text-decoration: none; font-size: 10px; margin: 0;"
>
<img src="https://pikwizard.com/pw/medium/74fc936fd6d25097cd2986b39b2f27c7.jpg" style="margin: 0; width: 100%;" alt="" />
<p style="font-size: 12px; margin: 0;">PikWizard</p>
</a>
</span>
</span>
Free (free of charge)
Free for personal and commercial use.
Author: Awesome Content
Similar Free Stock Images

Premium


Premium


Premium


Premium


Premium


Premium


Premium


Premium


Premium


Premium


Premium


Premium


Premium


Premium


Premium


Premium


Premium


Premium


Premium


Premium


Premium


Premium


Premium


Premium