- Home >
- Stock Photos >
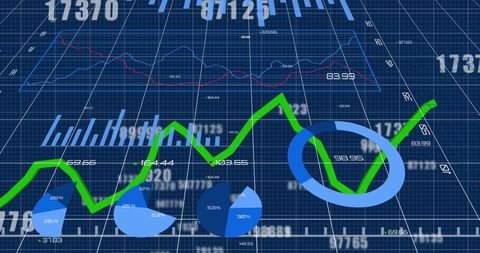
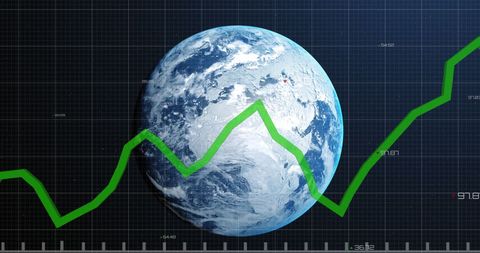
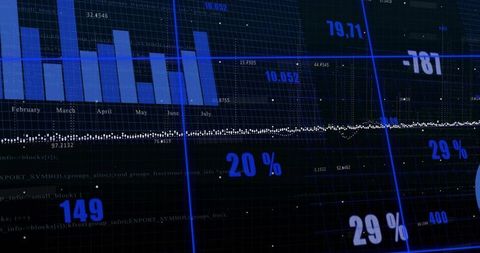
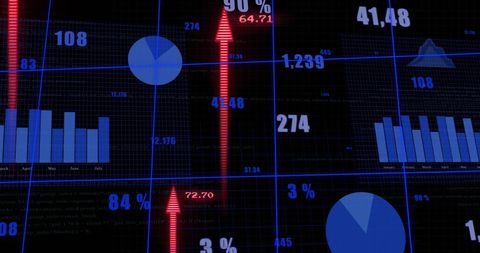
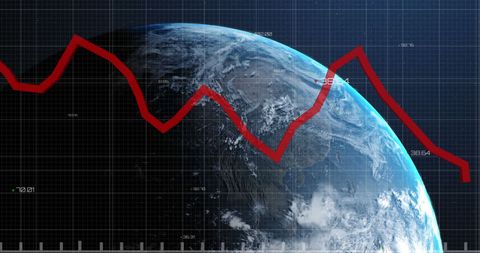
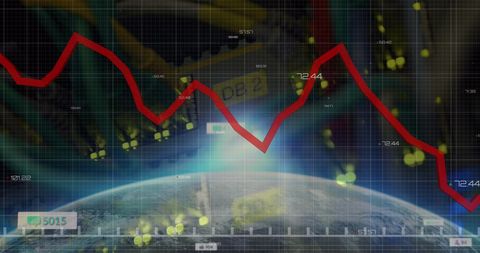
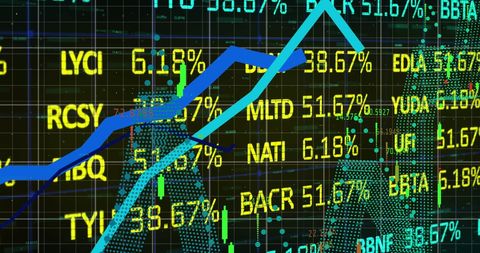
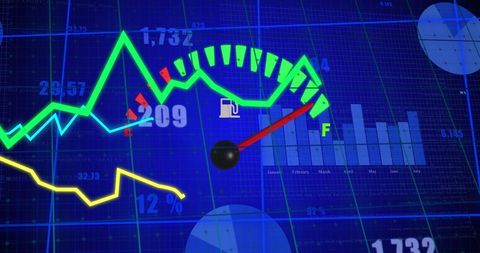
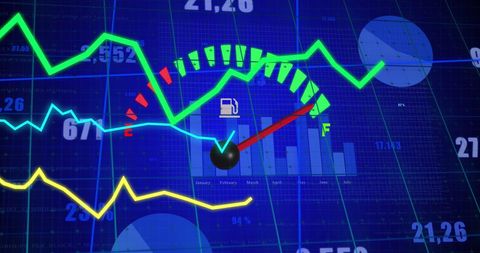
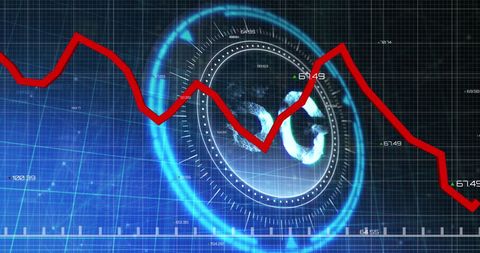
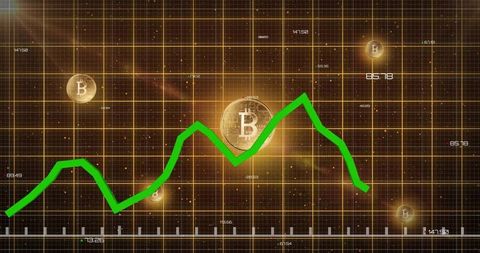
- Dynamic Financial Data Visualization Chart with Trending Lines
Dynamic Financial Data Visualization Chart with Trending Lines Image

Vibrant financial chart featuring statistical graphics with a trending line depicting stock or economic movement. Ideal for illustrating business trends, technological economics, and digital analytics in presentations, websites, reports, or financial storytelling. Highly suited for publications focusing on global market data and analysis.

downloads
Tags:
More
Credit Photo
If you would like to credit the Photo, here are some ways you can do so
Text Link
photo Link
<span class="text-link">
<span>
<a target="_blank" href=https://pikwizard.com/photo/dynamic-financial-data-visualization-chart-with-trending-lines/f929bd0eadd97bab9e2dc8702da4e109/>PikWizard</a>
</span>
</span>
<span class="image-link">
<span
style="margin: 0 0 20px 0; display: inline-block; vertical-align: middle; width: 100%;"
>
<a
target="_blank"
href="https://pikwizard.com/photo/dynamic-financial-data-visualization-chart-with-trending-lines/f929bd0eadd97bab9e2dc8702da4e109/"
style="text-decoration: none; font-size: 10px; margin: 0;"
>
<img src="https://pikwizard.com/pw/medium/f929bd0eadd97bab9e2dc8702da4e109.jpg" style="margin: 0; width: 100%;" alt="" />
<p style="font-size: 12px; margin: 0;">PikWizard</p>
</a>
</span>
</span>
Free (free of charge)
Free for personal and commercial use.
Author: Creative Art