
- Home >
- Stock Photos >
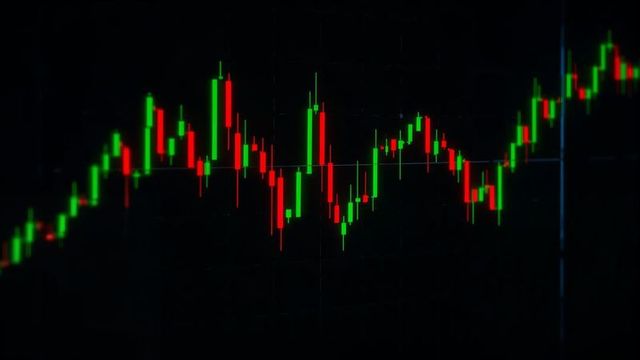
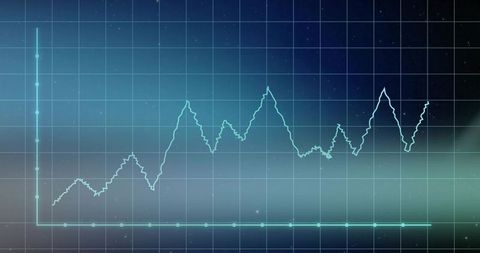
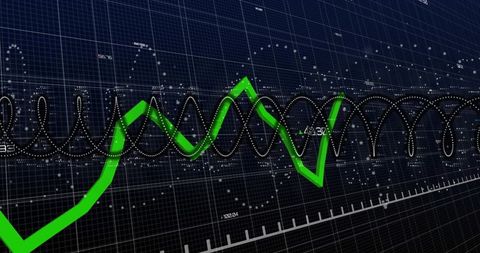
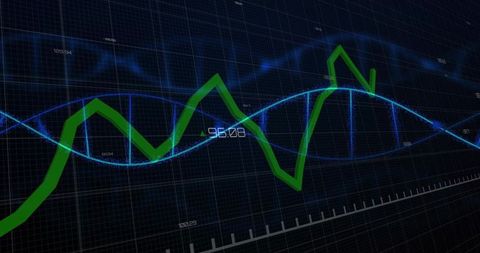
- Dynamic Financial Data Visualization Dashboard with Global Elements
Dynamic Financial Data Visualization Dashboard with Global Elements Image

This graphic displays a cutting-edge dashboard showing fluctuating financial charts integrated with a global map. Ideal for illustrating modern business intelligence concepts or finance-related analytics, enabling professionals to convey the impact of data-driven decision-making in a global economy. Perfect for presentations, reports, and articles about finance, analytics, or digital innovation in economic analysis.

downloads
Tags:
More
Credit Photo
If you would like to credit the Photo, here are some ways you can do so
Text Link
photo Link
<span class="text-link">
<span>
<a target="_blank" href=https://pikwizard.com/photo/dynamic-financial-data-visualization-dashboard-with-global-elements/3de4cb247546cce1512d09cba1c0f695/>PikWizard</a>
</span>
</span>
<span class="image-link">
<span
style="margin: 0 0 20px 0; display: inline-block; vertical-align: middle; width: 100%;"
>
<a
target="_blank"
href="https://pikwizard.com/photo/dynamic-financial-data-visualization-dashboard-with-global-elements/3de4cb247546cce1512d09cba1c0f695/"
style="text-decoration: none; font-size: 10px; margin: 0;"
>
<img src="https://pikwizard.com/pw/medium/3de4cb247546cce1512d09cba1c0f695.jpg" style="margin: 0; width: 100%;" alt="" />
<p style="font-size: 12px; margin: 0;">PikWizard</p>
</a>
</span>
</span>
Free (free of charge)
Free for personal and commercial use.
Author: Awesome Content
Similar Free Stock Images

AI


AI


AI


AI


AI


AI


AI


Explore More Free Stock Images