
- Home >
- Free Stock Photos & Images >
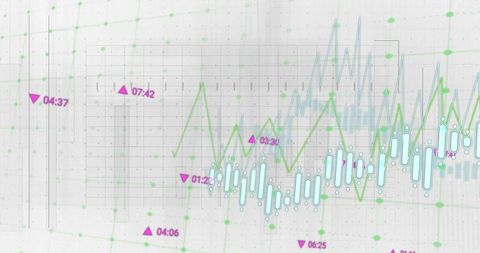
- Dynamic Financial Data Visualization Dashboard with Global Elements
Dynamic Financial Data Visualization Dashboard with Global Elements Free Stock Image

This graphic displays a cutting-edge dashboard showing fluctuating financial charts integrated with a global map. Ideal for illustrating modern business intelligence concepts or finance-related analytics, enabling professionals to convey the impact of data-driven decision-making in a global economy. Perfect for presentations, reports, and articles about finance, analytics, or digital innovation in economic analysis.
Powered by  - Get 15% off with code: PIKWIZARD15


downloads
Tags:
More
Credit Photo
If you would like to credit the Photo, here are some ways you can do so
Text Link
photo Link
<span class="text-link">
<span>
<a target="_blank" href=https://pikwizard.com/photo/dynamic-financial-data-visualization-dashboard-with-global-elements/3de4cb247546cce1512d09cba1c0f695/>PikWizard</a>
</span>
</span>
<span class="image-link">
<span
style="margin: 0 0 20px 0; display: inline-block; vertical-align: middle; width: 100%;"
>
<a
target="_blank"
href="https://pikwizard.com/photo/dynamic-financial-data-visualization-dashboard-with-global-elements/3de4cb247546cce1512d09cba1c0f695/"
style="text-decoration: none; font-size: 10px; margin: 0;"
>
<img src="https://thumbs.wbm.im/pw/medium/3de4cb247546cce1512d09cba1c0f695.jpg" style="margin: 0; width: 100%;" alt="Dynamic Financial Data Visualization Dashboard with Global Elements" />
<p style="font-size: 12px; margin: 0;">PikWizard</p>
</a>
</span>
</span>
Free (free of charge)
Free for personal and commercial use.
Author: Awesome Content
Similar Free Stock Images


Premium


AI

Premium


Premium


Premium


AI

Premium


Premium


Premium


Premium


Premium


Premium


Premium


Premium


Premium


Premium


Premium


Premium


Premium


Premium


Premium


Premium


AI


Premium


Premium


Premium


Premium

AI


AI


Premium

Explore More Free Stock Images