- Home >
- Stock Photos >
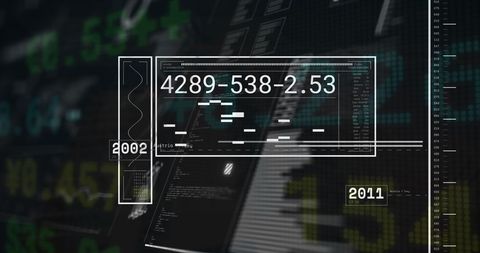
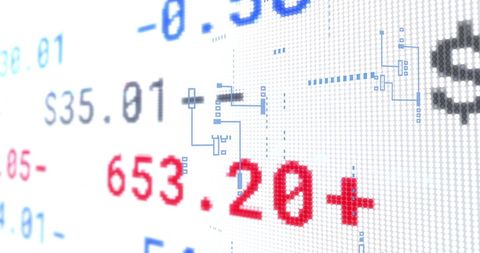
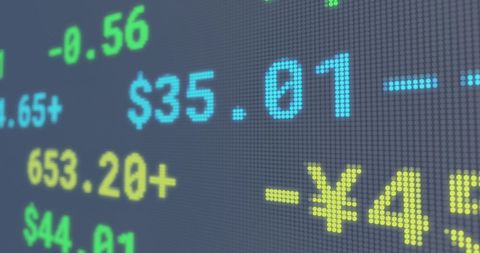
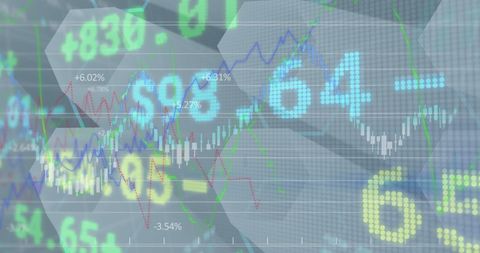
- Dynamic Financial Data Visualization in Digital Interface
Dynamic Financial Data Visualization in Digital Interface Image
Visualizing financial data with dynamic numbers for presentations or marketing materials related to finance, business, and economic trends. Ideal for technological advancements in global finance sectors and illustrating spirited financial shifts or digital analysis.

downloads
Tags:
More
Credit Photo
If you would like to credit the Photo, here are some ways you can do so
Text Link
photo Link
<span class="text-link">
<span>
<a target="_blank" href=https://pikwizard.com/photo/dynamic-financial-data-visualization-in-digital-interface/522c90e06ea331e14f12e4a25b7d959e/>PikWizard</a>
</span>
</span>
<span class="image-link">
<span
style="margin: 0 0 20px 0; display: inline-block; vertical-align: middle; width: 100%;"
>
<a
target="_blank"
href="https://pikwizard.com/photo/dynamic-financial-data-visualization-in-digital-interface/522c90e06ea331e14f12e4a25b7d959e/"
style="text-decoration: none; font-size: 10px; margin: 0;"
>
<img src="https://pikwizard.com/pw/medium/522c90e06ea331e14f12e4a25b7d959e.jpg" style="margin: 0; width: 100%;" alt="" />
<p style="font-size: 12px; margin: 0;">PikWizard</p>
</a>
</span>
</span>
Free (free of charge)
Free for personal and commercial use.
Author: Creative Art