
- Home >
- Stock Photos >
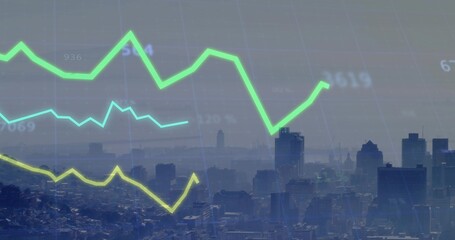
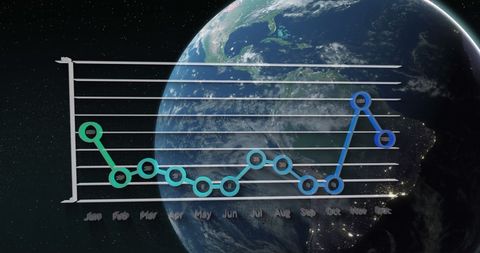
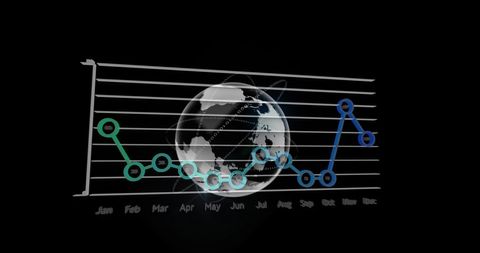
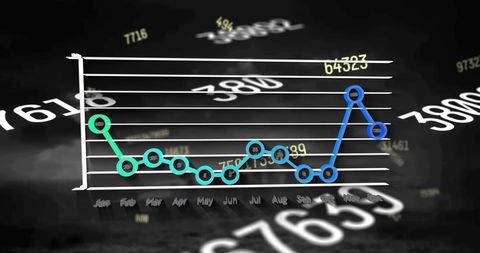
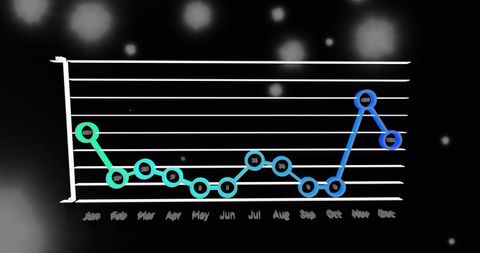
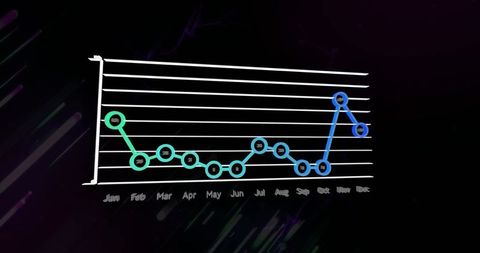
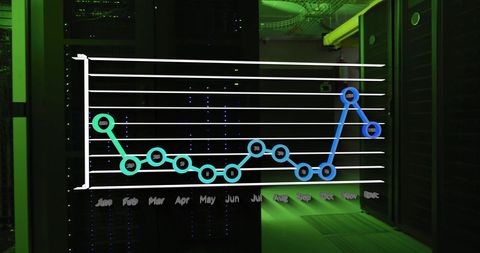
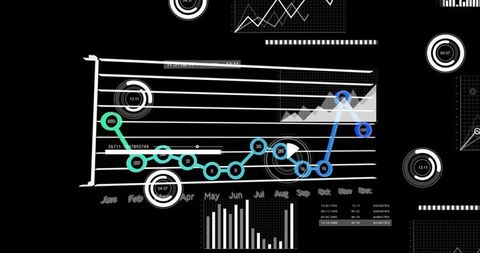
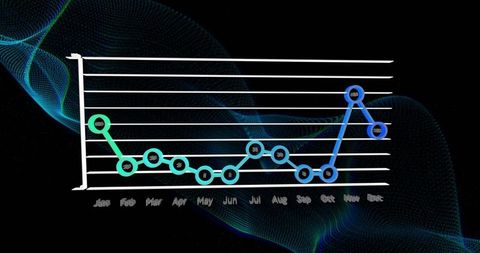
- Dynamic Financial Data Visualization on City Background
Dynamic Financial Data Visualization on City Background Image
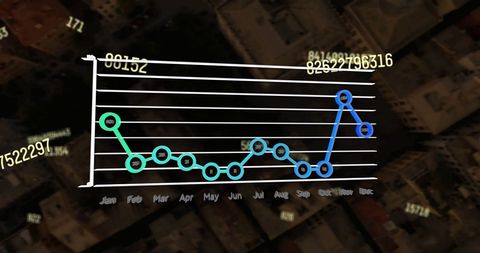
This image features a graph representing financial data analytics set against an urban cityscape backdrop. The combined elements of technology and urban life symbolize business growth and economic indicators. Suitable for use in presentations about financial trends, economic reports or technology-driven business models.
Powered by 


downloads
Tags:
More
Credit Photo
If you would like to credit the Photo, here are some ways you can do so
Text Link
photo Link
<span class="text-link">
<span>
<a target="_blank" href=https://pikwizard.com/photo/dynamic-financial-data-visualization-on-city-background/61d959fc02bd6967eb9b3a7e8365b6f2/>PikWizard</a>
</span>
</span>
<span class="image-link">
<span
style="margin: 0 0 20px 0; display: inline-block; vertical-align: middle; width: 100%;"
>
<a
target="_blank"
href="https://pikwizard.com/photo/dynamic-financial-data-visualization-on-city-background/61d959fc02bd6967eb9b3a7e8365b6f2/"
style="text-decoration: none; font-size: 10px; margin: 0;"
>
<img src="https://pikwizard.com/pw/medium/61d959fc02bd6967eb9b3a7e8365b6f2.jpg" style="margin: 0; width: 100%;" alt="" />
<p style="font-size: 12px; margin: 0;">PikWizard</p>
</a>
</span>
</span>
Free (free of charge)
Free for personal and commercial use.
Author: Creative Art
Similar Free Stock Images
Premium


Premium


Premium


Premium


Premium


Premium


Premium

Premium


Premium


Premium


Premium


Premium


Premium


Premium

Premium


Premium


Premium

Premium


Premium


Premium


Premium

Premium


Premium


Premium


Premium


Explore More Free Stock Images