
- Home >
- Stock Photos >
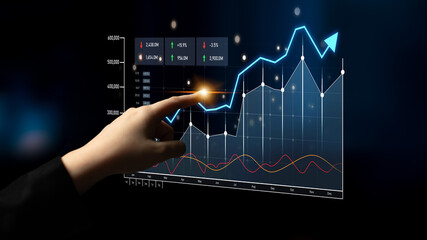
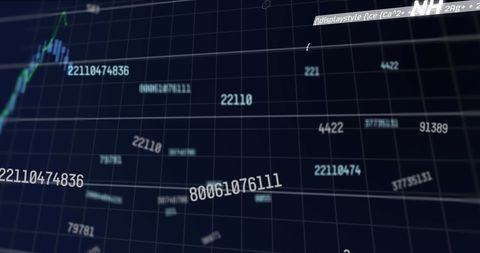
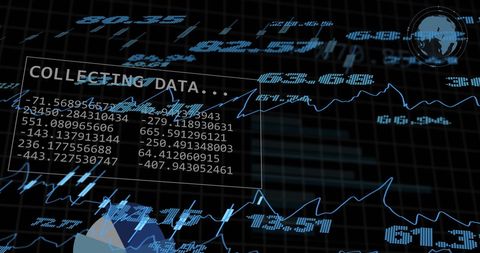
- Dynamic Financial Data Visualization on Digital Screen
Dynamic Financial Data Visualization on Digital Screen Image

Intricate financial charts and numbers overlay on a blue-hued digital screen, illustrating dynamic market trends. Useful for presentations on global business, financial analysis, investment strategies, and economic forecasting. Ideal for use in websites and media focusing on finance, technological advancements in data processing, and stock market insights.
Powered by 


downloads
Tags:
More
Credit Photo
If you would like to credit the Photo, here are some ways you can do so
Text Link
photo Link
<span class="text-link">
<span>
<a target="_blank" href=https://pikwizard.com/photo/dynamic-financial-data-visualization-on-digital-screen/1b156b26a64dc0b9e9dd023f5c116e36/>PikWizard</a>
</span>
</span>
<span class="image-link">
<span
style="margin: 0 0 20px 0; display: inline-block; vertical-align: middle; width: 100%;"
>
<a
target="_blank"
href="https://pikwizard.com/photo/dynamic-financial-data-visualization-on-digital-screen/1b156b26a64dc0b9e9dd023f5c116e36/"
style="text-decoration: none; font-size: 10px; margin: 0;"
>
<img src="https://pikwizard.com/pw/medium/1b156b26a64dc0b9e9dd023f5c116e36.jpg" style="margin: 0; width: 100%;" alt="" />
<p style="font-size: 12px; margin: 0;">PikWizard</p>
</a>
</span>
</span>
Free (free of charge)
Free for personal and commercial use.
Author: Authentic Images
Similar Free Stock Images

Premium


Premium


Premium


Premium


Premium


Premium


Premium


Premium


Premium


Premium


Premium
Premium


Premium


Premium


Premium


Premium


Premium


Premium


Premium

Premium


Premium


Premium


Premium

Premium


Premium

Explore More Free Stock Images