
- Home >
- Stock Photos >
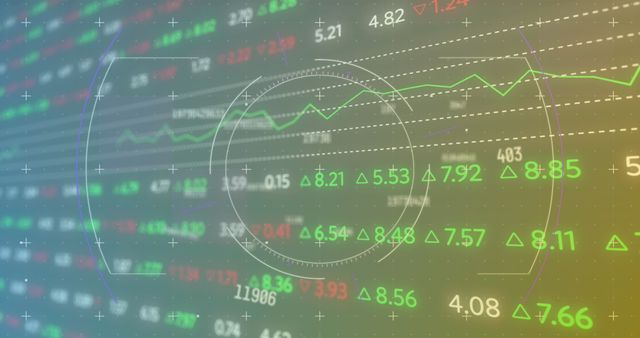
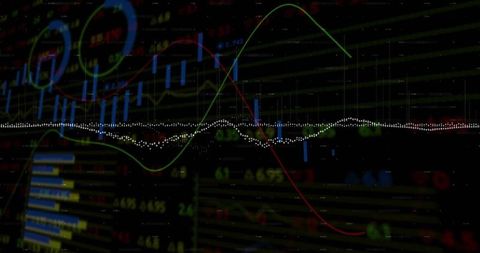
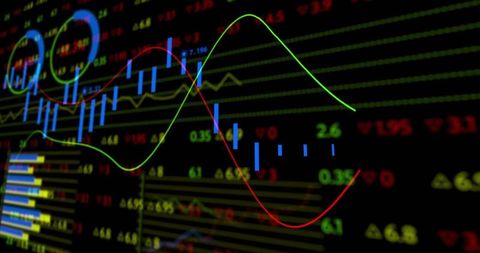
- Dynamic Financial Data Visualization On Green Background
Dynamic Financial Data Visualization On Green Background Image

This depiction shows various financial data and graphs overlayed on a green background, symbolizing activity in global business, finance, and economy. Vibrant lines represent stock market trends and analytics, useful for presentations, financial reports, or educational materials focused on finance, data analysis, or technical analysis in the business sector.
Powered by 


downloads
Tags:
More
Credit Photo
If you would like to credit the Photo, here are some ways you can do so
Text Link
photo Link
<span class="text-link">
<span>
<a target="_blank" href=https://pikwizard.com/photo/dynamic-financial-data-visualization-on-green-background/0759a79eb1502a2f612078d12d1af47d/>PikWizard</a>
</span>
</span>
<span class="image-link">
<span
style="margin: 0 0 20px 0; display: inline-block; vertical-align: middle; width: 100%;"
>
<a
target="_blank"
href="https://pikwizard.com/photo/dynamic-financial-data-visualization-on-green-background/0759a79eb1502a2f612078d12d1af47d/"
style="text-decoration: none; font-size: 10px; margin: 0;"
>
<img src="https://pikwizard.com/pw/medium/0759a79eb1502a2f612078d12d1af47d.jpg" style="margin: 0; width: 100%;" alt="" />
<p style="font-size: 12px; margin: 0;">PikWizard</p>
</a>
</span>
</span>
Free (free of charge)
Free for personal and commercial use.
Author: Authentic Images
Similar Free Stock Images

Premium


Premium


Premium

Premium


Premium


Premium


Premium


Premium


Premium


Premium


Premium


Premium


Premium


Premium


Premium

Premium


Premium


Premium


Premium


Premium


Premium


Premium


Premium


Premium


Premium


Explore More Free Stock Images