
- Home >
- Stock Photos >
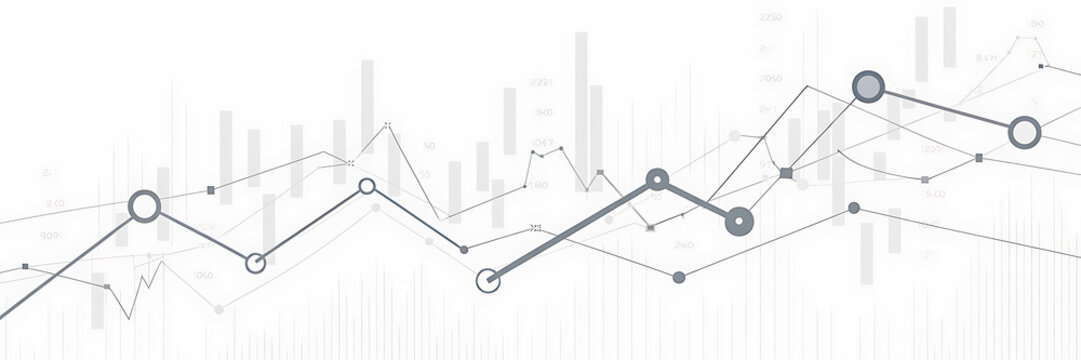
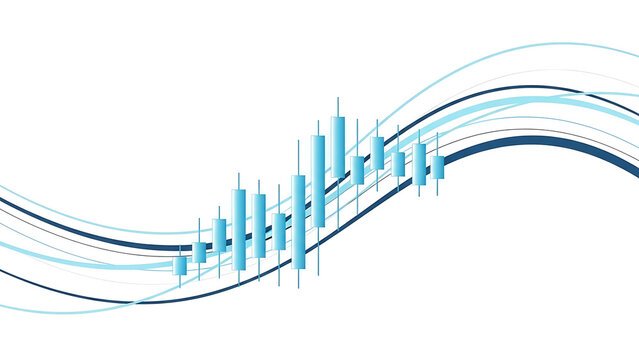
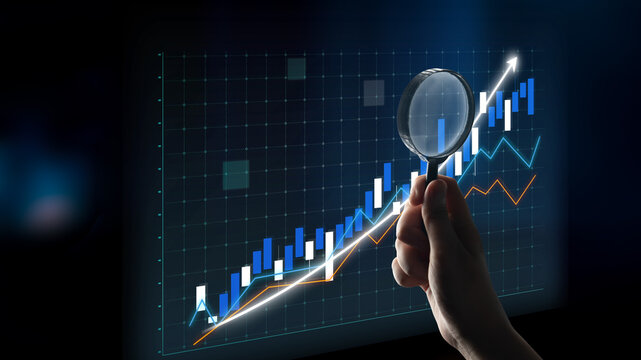
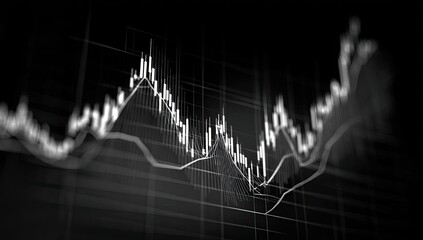
- Dynamic Financial Data Visualization with 3D Graphs and Candlesticks
Dynamic Financial Data Visualization with 3D Graphs and Candlesticks Image

Showcases 3D financial data with candlesticks and rising area graphs smothering financial trends and analytics growth. Ideal for illustrating investment opportunities, market analysis, and financial reports in presentations, business newsletters, digital transformations, and tech-focused advertising materials.
Powered by 


downloads
Tags:
More
Credit Photo
If you would like to credit the Photo, here are some ways you can do so
Text Link
photo Link
<span class="text-link">
<span>
<a target="_blank" href=https://pikwizard.com/photo/dynamic-financial-data-visualization-with-3d-graphs-and-candlesticks/004286c4e679e1d5d50421ba9e425c86/>PikWizard</a>
</span>
</span>
<span class="image-link">
<span
style="margin: 0 0 20px 0; display: inline-block; vertical-align: middle; width: 100%;"
>
<a
target="_blank"
href="https://pikwizard.com/photo/dynamic-financial-data-visualization-with-3d-graphs-and-candlesticks/004286c4e679e1d5d50421ba9e425c86/"
style="text-decoration: none; font-size: 10px; margin: 0;"
>
<img src="https://pikwizard.com/pw/medium/004286c4e679e1d5d50421ba9e425c86.jpg" style="margin: 0; width: 100%;" alt="" />
<p style="font-size: 12px; margin: 0;">PikWizard</p>
</a>
</span>
</span>
Free (free of charge)
Free for personal and commercial use.
Author: Creative Art
Similar Free Stock Images

Premium


Premium

Premium


Premium


Premium


AI


Premium


Premium

Premium

Premium

Premium


Premium


Premium


Premium


Premium

Premium


Premium


Premium


Premium


Premium

Premium


Premium


Premium


Premium


Premium


Premium

Explore More Free Stock Images