
- Home >
- Stock Photos >
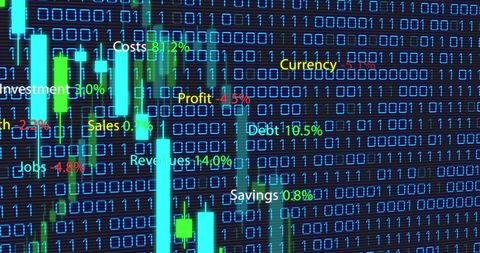
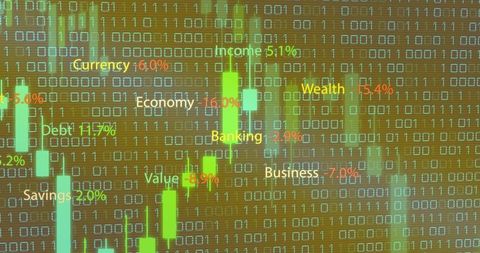
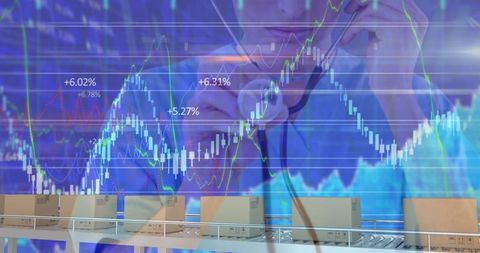
- Dynamic Financial Data Visualization With Binary Overlay
Dynamic Financial Data Visualization With Binary Overlay Image
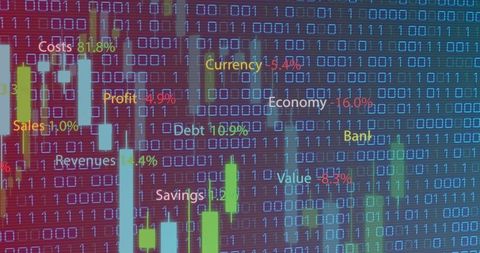
This visual displays a digital interface combining candlestick charts and binary code representing financial concepts like cost, profit, currency, and economy. Colors highlight various statistics, emphasizing the ever-changing financial environment. Ideal for illustrating topics concerning financial technology, economic health, and data-driven analysis, useful in articles and presentations focusing on financial trends and digitized analytics.

downloads
Tags:
More
Credit Photo
If you would like to credit the Photo, here are some ways you can do so
Text Link
photo Link
<span class="text-link">
<span>
<a target="_blank" href=https://pikwizard.com/photo/dynamic-financial-data-visualization-with-binary-overlay/f9f5372e37cc189af469eb5d4b4c533a/>PikWizard</a>
</span>
</span>
<span class="image-link">
<span
style="margin: 0 0 20px 0; display: inline-block; vertical-align: middle; width: 100%;"
>
<a
target="_blank"
href="https://pikwizard.com/photo/dynamic-financial-data-visualization-with-binary-overlay/f9f5372e37cc189af469eb5d4b4c533a/"
style="text-decoration: none; font-size: 10px; margin: 0;"
>
<img src="https://pikwizard.com/pw/medium/f9f5372e37cc189af469eb5d4b4c533a.jpg" style="margin: 0; width: 100%;" alt="" />
<p style="font-size: 12px; margin: 0;">PikWizard</p>
</a>
</span>
</span>
Free (free of charge)
Free for personal and commercial use.
Author: People Creations
Similar Free Stock Images


AI

AI


AI


AI


AI


AI


Explore More Free Stock Images