
- Home >
- Stock Photos >
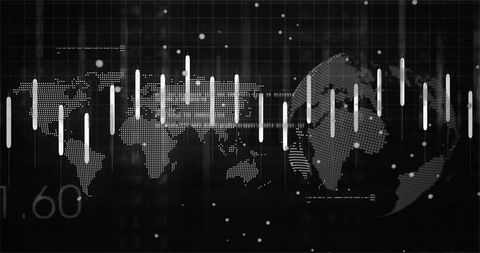
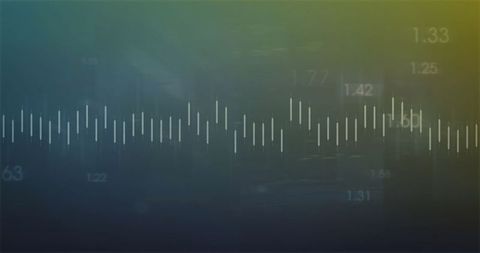
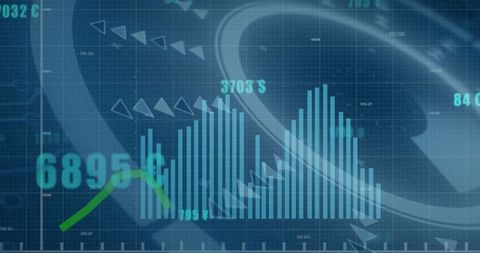
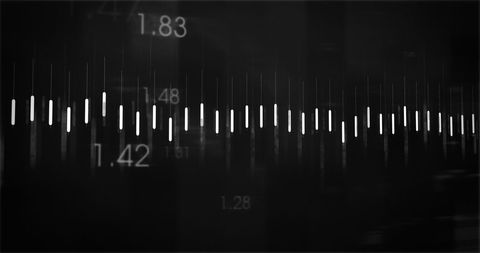
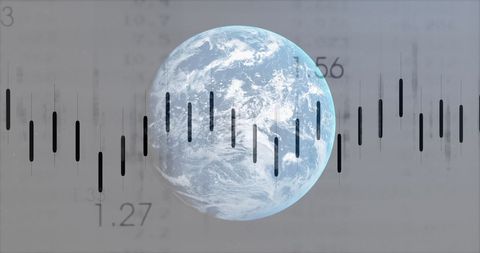
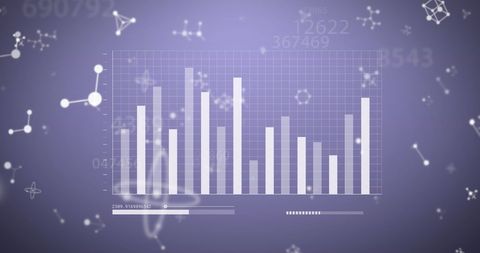
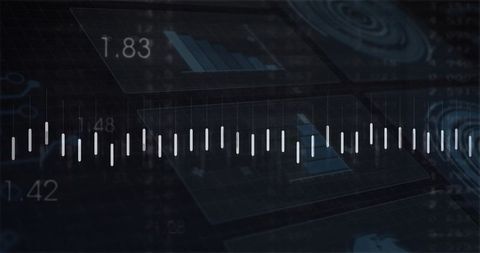
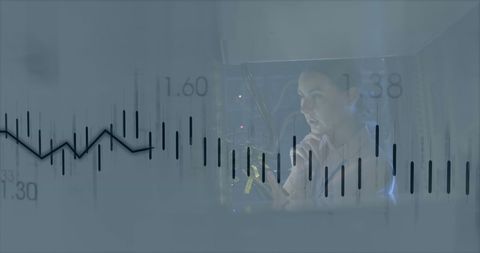
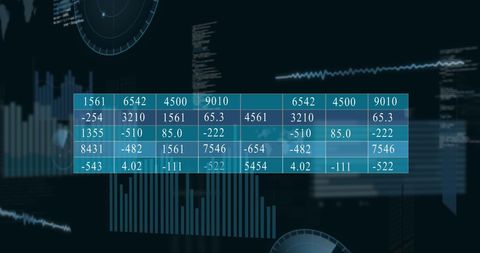
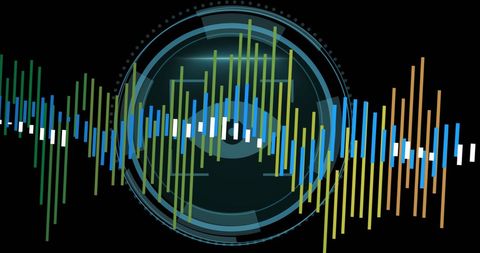
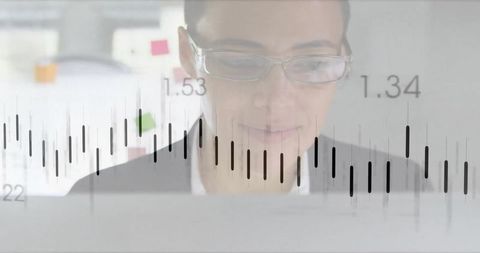
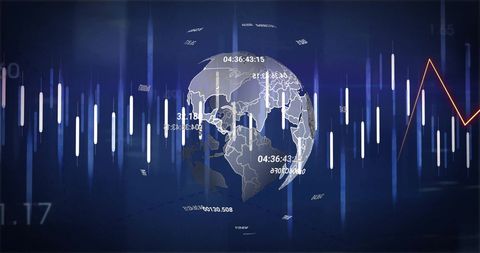
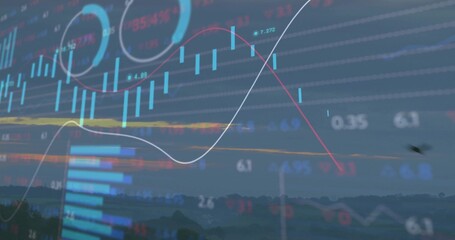
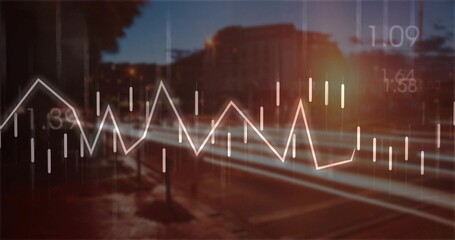
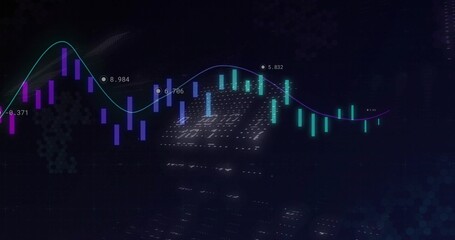
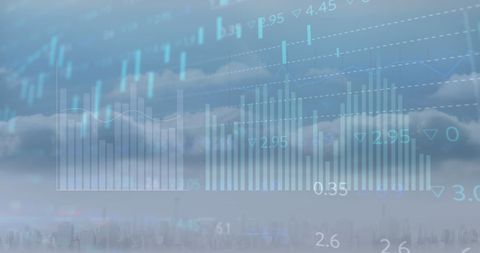
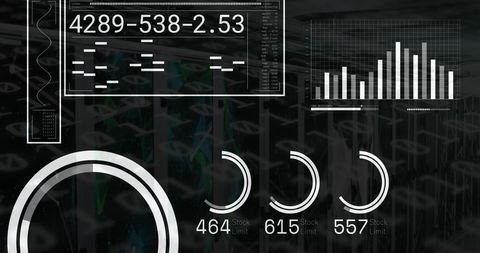
- Dynamic Financial Data Visualization with Candlestick Bars
Dynamic Financial Data Visualization with Candlestick Bars Image
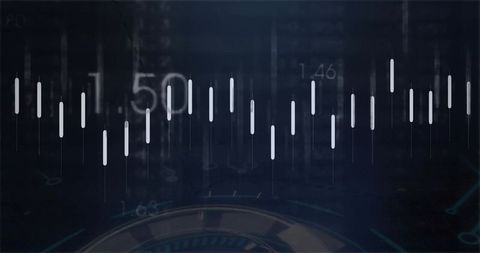
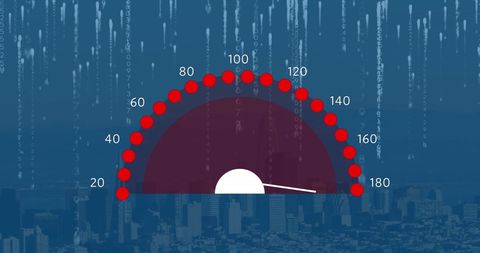
Visual representation uses dynamic candlestick bars on dashboard to display financial data trends. Numeric labels offer details while the gauge suggests evaluation points. Useful for financial presentations, business meetings, enhancing data insights in investment sectors.
Powered by 


downloads
Tags:
More
Credit Photo
If you would like to credit the Photo, here are some ways you can do so
Text Link
photo Link
<span class="text-link">
<span>
<a target="_blank" href=https://pikwizard.com/photo/dynamic-financial-data-visualization-with-candlestick-bars/23aae957c50736152be5f186d3580d01/>PikWizard</a>
</span>
</span>
<span class="image-link">
<span
style="margin: 0 0 20px 0; display: inline-block; vertical-align: middle; width: 100%;"
>
<a
target="_blank"
href="https://pikwizard.com/photo/dynamic-financial-data-visualization-with-candlestick-bars/23aae957c50736152be5f186d3580d01/"
style="text-decoration: none; font-size: 10px; margin: 0;"
>
<img src="https://pikwizard.com/pw/medium/23aae957c50736152be5f186d3580d01.jpg" style="margin: 0; width: 100%;" alt="" />
<p style="font-size: 12px; margin: 0;">PikWizard</p>
</a>
</span>
</span>
Free (free of charge)
Free for personal and commercial use.
Author: Awesome Content
Similar Free Stock Images
Premium

Premium

Premium

Premium


Premium


Premium


Premium


Premium


Premium

Premium
Premium


Premium


Premium


Premium

Premium


Premium


Premium


Premium


Premium


Premium


Premium
Premium


Premium


Premium


Premium

Explore More Free Stock Images