
- Home >
- Stock Photos >
- Dynamic Financial Data Visualization with Candlestick Charts
Dynamic Financial Data Visualization with Candlestick Charts Image

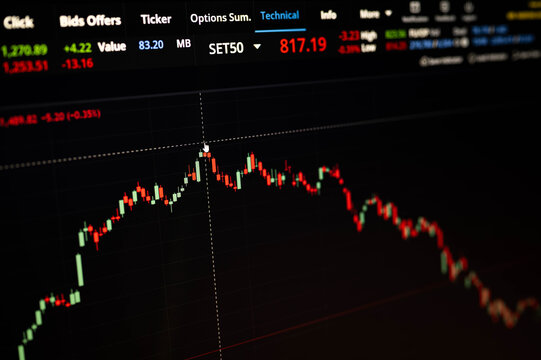
This visually dynamic representation of financial data highlights candlestick charts, integral to modern trading environments. Vibrant numeric tags and light streaks offer a digital visualization of market trends, perfect for illustrating connections between technology and finance. Ideal for use in articles discussing stock market analytics, fintech solutions, or educational materials on trading techniques and software development.
Powered by 


downloads
Tags:
More
Credit Photo
If you would like to credit the Photo, here are some ways you can do so
Text Link
photo Link
<span class="text-link">
<span>
<a target="_blank" href=https://pikwizard.com/photo/dynamic-financial-data-visualization-with-candlestick-charts/3c8464cb33d50fcb4d6114317888a566/>PikWizard</a>
</span>
</span>
<span class="image-link">
<span
style="margin: 0 0 20px 0; display: inline-block; vertical-align: middle; width: 100%;"
>
<a
target="_blank"
href="https://pikwizard.com/photo/dynamic-financial-data-visualization-with-candlestick-charts/3c8464cb33d50fcb4d6114317888a566/"
style="text-decoration: none; font-size: 10px; margin: 0;"
>
<img src="https://pikwizard.com/pw/medium/3c8464cb33d50fcb4d6114317888a566.jpg" style="margin: 0; width: 100%;" alt="" />
<p style="font-size: 12px; margin: 0;">PikWizard</p>
</a>
</span>
</span>
Free (free of charge)
Free for personal and commercial use.
Author: Authentic Images