
- Home >
- Stock Photos >
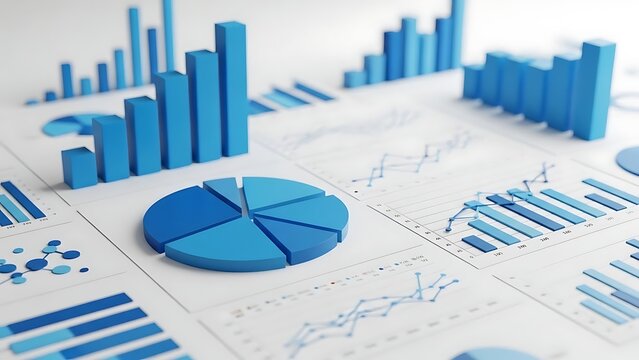
- Dynamic Financial Data Visualization with Charts and Analytics
Dynamic Financial Data Visualization with Charts and Analytics Image
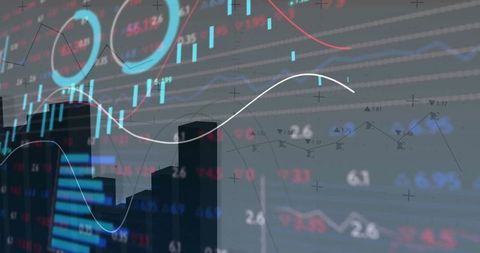
Creative abstraction represents the integration of multiple data forms in the financial sector. Bar charts, candlesticks, and trend lines combine to illustrate analytical dynamics ideal for presentations related to finance, investment strategies, digital transformation, and data integration.
Powered by 


downloads
Tags:
More
Credit Photo
If you would like to credit the Photo, here are some ways you can do so
Text Link
photo Link
<span class="text-link">
<span>
<a target="_blank" href=https://pikwizard.com/photo/dynamic-financial-data-visualization-with-charts-and-analytics/6975e845bd353387847142419f3a6d19/>PikWizard</a>
</span>
</span>
<span class="image-link">
<span
style="margin: 0 0 20px 0; display: inline-block; vertical-align: middle; width: 100%;"
>
<a
target="_blank"
href="https://pikwizard.com/photo/dynamic-financial-data-visualization-with-charts-and-analytics/6975e845bd353387847142419f3a6d19/"
style="text-decoration: none; font-size: 10px; margin: 0;"
>
<img src="https://pikwizard.com/pw/medium/6975e845bd353387847142419f3a6d19.jpg" style="margin: 0; width: 100%;" alt="" />
<p style="font-size: 12px; margin: 0;">PikWizard</p>
</a>
</span>
</span>
Free (free of charge)
Free for personal and commercial use.
Author: People Creations