- Home >
- Stock Photos >
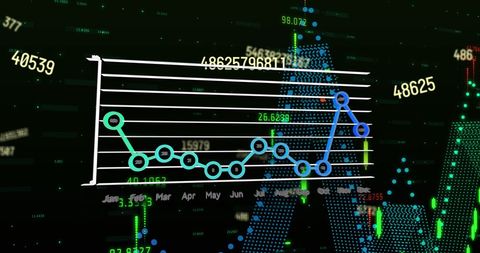
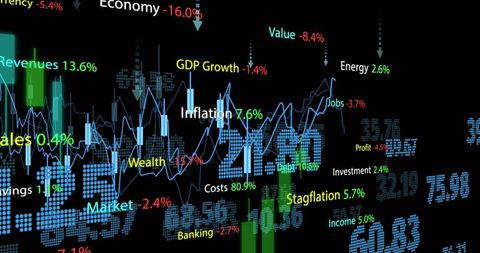
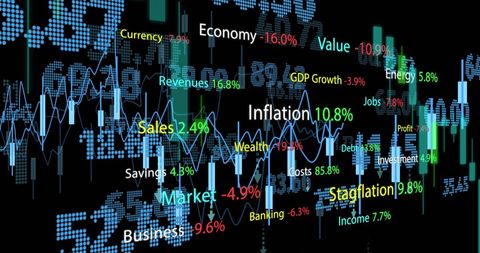
- Dynamic Financial Data Visualization with Digital Interface
Dynamic Financial Data Visualization with Digital Interface Image

Intricate visualization of financial data suited for financial articles, business reports, presentations emphasizing data analytics, and resources exploring stock market trends or global trade dynamics. Ideal for content focusing on digital finance technologies or cryptocurrencies.

downloads
Tags:
More
Credit Photo
If you would like to credit the Photo, here are some ways you can do so
Text Link
photo Link
<span class="text-link">
<span>
<a target="_blank" href=https://pikwizard.com/photo/dynamic-financial-data-visualization-with-digital-interface/e35662a719676816f8279d891983c601/>PikWizard</a>
</span>
</span>
<span class="image-link">
<span
style="margin: 0 0 20px 0; display: inline-block; vertical-align: middle; width: 100%;"
>
<a
target="_blank"
href="https://pikwizard.com/photo/dynamic-financial-data-visualization-with-digital-interface/e35662a719676816f8279d891983c601/"
style="text-decoration: none; font-size: 10px; margin: 0;"
>
<img src="https://pikwizard.com/pw/medium/e35662a719676816f8279d891983c601.jpg" style="margin: 0; width: 100%;" alt="" />
<p style="font-size: 12px; margin: 0;">PikWizard</p>
</a>
</span>
</span>
Free (free of charge)
Free for personal and commercial use.
Author: Creative Art