1. Home > 
  2. Stock Photos > 
  3. Dynamic Financial Data Visualization with Graphs and Charts

Dynamic Financial Data Visualization with Graphs and Charts Image

Dynamic Financial Data Visualization with Graphs and Charts

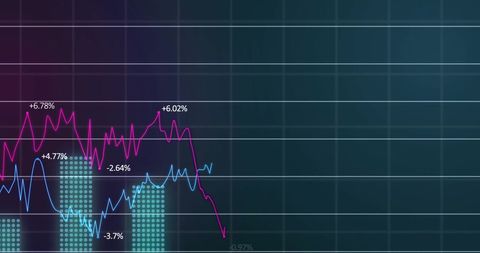
This digital illustration features dynamic graphs and charts tracking financial data trends on a dark background, conveying themes of business and economic analysis. It is ideal for use in presentations, financial reports, corporate websites, or educational materials dealing with market trends and data processing. The visual emphasis on data analytics can enhance materials discussing finance, economics, or digital technology.

Powered by Adobe logo
Business people analyzing financial charts and graphs at meeting - Powered by Adobe
Dynamic blue and green digital stock market graph with bar charts and lines on a dark background, representing financial data analysis, investment trends, business growth, and global economy fluctuat - Powered by AdobeAi generated image of laptop displaying financial data analysis charts and graphs isolated on transparent background - Powered by AdobeAnalyzing real-time financial market trends and stock performance with vibrant candlestick charts and data displayed on a digital screen, symbolizing investment analysis and global economic activity - Powered by AdobeMagnifying glass over financial charts and graphs showing data analysis and growth - Powered by Adobe

Credit Photo

If you would like to credit the Photo, here are some ways you can do so

Free (free of charge)

Free for personal and commercial use.

Author: Awesome Content

Similar Free Stock Images

Dynamic Financial Graph with Wavy Data Line over Navy Background
Premium
Professional Latina woman sits at desk in coworking office, focused on her work, looking at computer screen displaying financial charts and stock market data related to trading or financial analysis
Dynamic Stock Market Chart with Fluctuating Trends and Data Points
Futuristic Financial Chart with Declining Trend
Premium
A business professional engages with financial data on a laptop, surrounded by innovative graphs and charts that signify growth and success in a corporate environment. Scalp
Financial Graphs Overlaying Shopping Bag Representation Economy
Digital Financial Data Analytics and Trend Graphs
Dynamic Financial Graphs Overlaying Modern Cityscape
Rising Financial Data Graph on Digital Grid Background
Premium
Abstract digital illustration of business growth charts and graphs representing financial data and investment analysis in a futuristic design
Financial Data Overlay on Cityscape Visualizing Market Trends
Abstract Digital Data Graph and Diagrams on Gray Background
Digital Data Processing with Graph and Grid Technology Interface
Stagflation Concept with Digital Financial Graphs
Premium
Futuristic city skyline overlaid with financial charts at night
City Skyline with Overlay of Financial Market Trends
Dynamic Green Line Graph Depicting Financial Data
Dynamic Financial Data Displays Stock Market Trends
NFT Financial Data Visualization with Digital Graph Overlay
Premium
Digital forest data analysis with glowing charts and bar graphs. Abstract concept of environmental economics finance and tech, showing growth and trends in nature.
Financial Graph Analysis on Green Grid Background
Rising Stock Market Graph on Blue Financial Background
Financial Data Analysis and Digital Interface Concept
Digital Financial Data Overlaying City Skyline at Dusk
Premium
Ai generated image of blue financial graph with upward trend isolated on transparent background
Glowing Blue Cardiograph on Black Background Interface
Abstract Digital Finance Chart Showing Fluctuating Graph Lines
Digital Interface with Global Financial Graphs Background
Futuristic Digital Graph Showing Data Trends on Analytic Interface
Premium
Business audit stock financial finance management on analysis data strategy with graph accounting marketing or report chart economy investment research profit concept
Digital Graphs and Data Visualization on Green Background
Digital DNA Strand Overlaid with Scientific Data Patterns
Dynamic Business Data and Cityscape Visualization
Vibrant Pink Cardio Wave on Digital Display
Digital Data Visualization with Trend Lines and Percentage Changes
Dynamic Financial Graph in Virtual Red Grid Background
Financial Data Analysis Vibrant Graphs on Blue Background
Dynamic Financial Data on Digital Screen
Premium
Data Examination: A magnifying glass hovers over financial reports and charts on a sky-blue surface, providing an overview of the business analysis.
Premium
Tablet displaying financial data graphs on a dark control panel
Futuristic Global Finance Chart with Rotating Globe Animation
Financial Graph Displayed Over City Skyline at Sunset
Data Recovery Progress Display on Digital Interface
Futuristic Digital Data Analytics Interface Display
Premium
Manager touches growth graph on analytics dashboard. Business data analysis reports with marketing finance management strategy. Digital charts graphs increase business performance, sales statistic
Optimized Statistical Data Overlain on Corporate Architecture
Stagflation Concept Overlaid on Palestinian Flag Background
Rising Financial Graph on Dark Grid Background
Abstract Digital Charts with Social Media Metrics Rising
Premium
AI finance business data analysis digital technology investment trading market stock, financial analyst using advanced holographic interface for global market insight, smart investment strategy
Dynamic Financial Data Visualizations on Grid Interface
Data Trends and Analysis on 3D Digital Grid
Rising Digital Graph and Data Visualizations on Black Background
European Market Data Overlay with EU Flag and Financial Graphs
Premium
Business charts graphs analysis with calculator and magnifying glass
Financial Graph and Waves Representing Market Trends and Data
Analyzing Stock Market Trends with Dynamic Graphs and Data
Economic and Political Factors Influence Investment Trends
Slumpflation Concept on Armenian Flag Background
Dynamic Financial Data Overlaid on Grid Background
Dynamic Stagflation Concept Displaying Economic Burdens
Abstract Representation of Financial Data Processing
Dynamic Financial Data Waves in Digital Cyber World
Dynamic Financial Growth Digital Chart Display
Premium
Analyzing financial data on a smartphone, with charts and graphs in the background
Colorful Digital ECG Heartbeat Graphs on Black Background
Digital Financial Data with Graph and Grid Patterns
Digital Cardiograph Display with Green Line over Black Background
Premium
Stethoscope and charts on desk representing healthcare analytics and financial performance
Digital Financial Data Graph Showcasing Market Trends
Data Analytics Graphs on Digital Interface Background
Dynamic Financial Data Chart Showing Trend Analysis
Cityscape with Digital Stock Market Graphs and Statistics
Futuristic Financial Graph with Data Overlays in Blue Holographic Style
Premium
Analyzing financial charts and data reports in modern office setting
Stagflation with Polish Economic Data Visualization
Financial Data Graph Rendering Global Market Trends
Dynamic Data Graphs on Digital Interface Background
Glowing Cardiograph Line on Black Background Illustrates Vital Health Monitoring
Premium
E-commerce sales growth represented by colorful bar charts and financial graphs in a modern corporate environment
Digital Cardiograph on Black Background in Colorful Display
Line Graphs on Digital Background Show Financial Data Trends
Financial Stock Market Data Visualization with Declining Trends
Premium
Female expert in glasses looking at screen with financial data
Premium
Trader analyzing financial data on laptop at home office workspace
Futuristic Graph with Digital Globe Symbolizing Global Technology Connections
Colorful Data Visualization on Dark Background
Financial Data Flow against Urban Skyline Backdrop
Neon Electrocardiogram Wave On Black Background
Premium
Close-up of business people hands pointing at data charts and using a tablet during a strategy meeting in a bright, modern office space.
Premium
Business financial chart with moving up arrow graph.Financial data charts with glowing stock market graphs.Stock market investment data and analysis finance graph.
Digital Stock Market Graph Red Trendline on Green Background
Graph Lines Portraying Financial Data Trends
Futuristic Digital Representation of DNA Strand
Dynamic Financial Data Visualization on Digital Grid Background
Digitized Medical Data Overlay with Cardio Graph and Medicine
Premium
Magnifying glass focusing on candlestick chart, showcasing market analysis on a dark background, concept for financial review, investment strategy and business intelligence data analysis
Digital Financial Dashboard with Graphs and Data Visualization
Digital Finance: Modern Stock Market Analysis Display
Stagflation Text on Bahrain Flag with Rising Graph
Interactive Social Media Metrics Overlaid on Business Data Graph
Digital Data Processing with Chart in Futuristic Interface
Dynamic Financial Graph Over Red Background
Innovative Data Analysis with Dynamic Line Graph and Digital Elements
Premium
Business meeting in progress as two individuals review financial data and colorful graphs displayed on a laptop, with charts and documents around them.
Digital Financial Data and AI Illustration Networking Globally
Data Analytics and Financial Growth Indicators
Statistical Data Processing with Graph Overlay on Buildings
Financial Data Analysis with Futuristic Technology Interface
Premium
Data Analyst Using Data Analytics KPI
Financial Data Line Graph on Digital Display
Abstract Financial Graph with Rising Waves on Red Gradient
Global Networking Concept with 6G Technology Display
Digital Finance Chart Overlaying Globe Background
Neon Round Scanner with Statistical Data Display
Dynamic Financial Graphs Overlaying Urban Skyline
Dynamic Financial Charts and Graphs Indicating Market Trends
Falling Line Graph on Navy Background Illustrating Economic Decline
Dynamic Financial Chart with Data Points on Red Grid Background
Premium
Magnifying glass on charts graphs paper. Financial development, Banking Account, Statistic, Investment Analytic research data economy.
Digital Interface Showing Global Business Data Analytics
Digital Graph Displaying Dynamic Data Analysis
Line Graph Illustrating Data Trend on Green Digital Background
Digital Financial Graph Over Violet Background in Abstract Style
Premium
Financial market data analysis with glowing 3D bar and line charts on dark background showing economic trends and growth concept visualization. 3D Rendering
Explore More Free Stock Images