1. Home > 
  2. Stock Photos > 
  3. Dynamic Financial Data Visualization with Highway Background

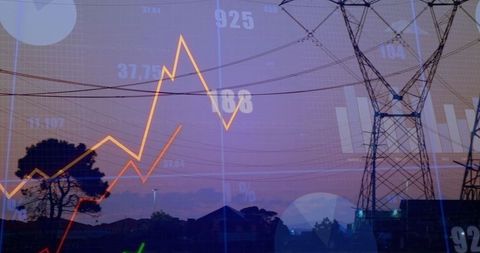
Dynamic Financial Data Visualization with Highway Background Image

Dynamic Financial Data Visualization with Highway Background

Dynamic dashboard blending colorful financial data overlays against a highway image at dusk. Visualization elements include line charts, bar charts, and pie charts, highlighting finance, innovation, and growth themes, suitable for presentations, tech articles, marketing materials related to finance and data analysis.

Powered by Shutterstock logo - Get 15% off with code: PIKWIZARD15
Internet cyberspace data information collection analytical statistics computer storage ai artificial intelligence calculation, blue background banner copyspace. - Powered by Shutterstock - Get 15% off with code: PIKWIZARD15Visualizing central data analytics on digital interface, with pie charts bar graphs formulas. Futuristic, technology, visualization, infographics, digital, scientific, analytical - Powered by Shutterstock - Get 15% off with code: PIKWIZARD15Office man finger touch hud, virtual screen with stock market changes, business candlesticks graph chart. Double exposure of blue and white lines, growing numbers, online trading - Powered by Shutterstock - Get 15% off with code: PIKWIZARD15Digital economic growth chart with a rising trend towards 2025, symbolizing future market predictions. - Powered by Shutterstock - Get 15% off with code: PIKWIZARD15Male trader sits at desk hold smart phone with stock market data, using laptop display graph and chart, analyzing investment, check trading stocks information, view over shoulder. Growth, profit, apps - Powered by Shutterstock - Get 15% off with code: PIKWIZARD15

Credit Photo

If you would like to credit the Photo, here are some ways you can do so

Free (free of charge)

Free for personal and commercial use.

Author: Awesome Content

Similar Free Stock Images

Futuristic Digital Interface with City Overlay and Data Graphs
Premium
Displaying line chart fluctuating on market terminal, with green bars, percentages and grid overlay. Analytics, data visualization, finance, technology, digital interface, investment, performance
Futuristic Data Network and Processing Visualization
Financial Data with Trend Lines and Bar Charts
Financial Data Charts Over Belgian Flag Illustrating Global Economy
Digital Data Processing with Cyber Security System Visualization
Premium
chart, diagram, graph, index, invest, marketing, growth, analytics, opportunity, analysis. A man is drawing a graph on a laptop, with a line is pointing upwards. The graph is showing a positive trend.
Futuristic WOW Text on Digital Grid Interface
Digital Interface of Business Professionals Analyzing Financial Data
Digital Data Analysis Interface with Financial Graphs and Codes
Abstract Digital Finance Data Analysis Background
Premium
Growth trend forecast and financial data analytics for year 2026 with a business report on documents for financial planning and stock market investment.
Digital Financial Data Analysis with Global Business Concept
Data Processing Over Digital Network Interface
Futuristic City Skyline with Financial Data Overlay
Cybersecurity Threats Impacting Global Financial Markets
Premium
Mature analyst wearing glasses and plaid shirt analyzing charts in office, with red line graphs. Financial, data, analytics, professional, modern, enterprise, corporate
Futuristic Data Visualization with Dynamic Graphs
Futuristic Data Analytics Display on Office Windows
Financial Data Visualization Against City Background
Glowing Neon You Win Holographic Futuristic Concept
Premium
Man holding blue holographic globe with nodes connected around earth. Concept of global network connection, communication, fintech, data exchange, worldwide exchange of information and online banking.
Rising Graph and Data Visual Over Tranquil Dawn Landscape
Business Team Collaborating on Data Analysis With Tech Interface
Futuristic Financial Dashboard with Charts and Data Visuals
Night Highway Overpass with Dynamic Financial Chart Overlay
Premium
Analyzing healthcare worker in scrubs and mask monitoring candlestick charts in hallway, copy space. Medical professional, financial data, analytical, modern, healthcare industry, digital technology,
Futuristic Financial Chart With Geometric Tunnel and Data Visualization
Dynamic Financial Charts and Stock Market Analytics Display
Grinding Rail Machinist with Data Overlay in Workshop
Global Financial Data Visualization with Charts and World Map
Dynamic Digital Interface Representing Global Finance and Data Processing
Rising Graph with Data and Analysis Objects on Blue Background
Premium
Analyzing executive in suit jacket annotating digital bar and line charts in office, with clipboard. Financial, data, analytics, corporate, technology, professional, modern
Financial Data Processing with Blue Background Overlay
Global Financial Data Analysis with Dynamic Graphs on World Map
Digital Data Analytics Interface with Futuristic Visuals
Financial Data Graphic with Rising Trends on Digital Grid
Premium
Hands holding a tablet with glowing bar and line charts, global map, and financial data visuals on a dark background. Concept of stock market analytics
Diverse Business Team Analyzing Global Data Charts
Abstract Digital Financial Data Graph Chart
Businessman Analyzing Data Visualization Interface in Modern Office
Digital NFT Concept with Data Visualizations on Blue Background
Premium
Internet cyberspace internet data collection analytical computer ai artificial intelligence calculation, blue background banner copyspace.
Business Team Collaborating on Financial Data With Digital Graphics Overlay
Paris Architecture Illuminated by Financial Market Trends Overlay
Futuristic Data Interface with Rotating Dial and Progress Bar
Digital Finance Dashboard with Rising Graph and Percentages
Premium
Displaying trading interface showing ticker symbols over 3D bar chart grid, stock ticker overlay. Financial data, analytics, technology, investment, digital display, market analysis, business
Financial Market Chart with Candlestick Patterns and Trend Analysis
Futuristic Urban Data Visualization at Night
Encrypted Data Transfer and Processing Virtual Display
Engineer Collaborating Tech Innovations with Global Connectivity
Premium
Displaying finance interface showing tickers with percentages and green line graphs in trading room. Technology, data visualization, financial analysis, digital dashboard, corporate, modern,
Futuristic Digital File Deletion Dashboard
Business Dashboard with dynamic data analytics in a conference room
Financial Data Overlay on Office Desk with Visible Growth Chart
Colleagues Analyzing Charts on Transparent Display in Modern Boardroom
Premium
Man wearing plaid shirt analyzing market charts in office, with candlestick overlay and +6.31%. Financial, data, analytics, digital, technology, professional, investment
Futuristic Digital Dashboard with World Map and Data Visualization
Physician Examining Infant with Data and Technology Overlays
Digital Dashboard with Data Analytics and Visualization
Futuristic Data Processing Interface Concept with Virtual Elements
Financial Analysis in Modern Office Environment
Digital Financial Data and Statistics Analyzing Concept
Premium
Experience Advanced Corporate Data Analysis With Professional Interactive Holographic Display, Showcasing Key Performance Indicators And Digital Line Graphs Using Cutting edge Technology
Complex Financial Data Visuals with Coding Elements and Charts
Futuristic Retrowave Digital Interface Concept
Financial Data Charts with Viewing Grid in Dark Perspective
Dynamic WOW Text with Futuristic Digital Cityscape
Premium
Displaying aerial farmland with snowy fields and flooded patches, showing financial chart overlay. Agriculture, farmland, flood, financial data, analytics, rural, meteorology
Futuristic Digital Interface With Global Data Networking
Data Analytics and Finance Indicators Over City
Digital Graph and Data Analysis with Financial Growth Trends
African American Woman Engaging with AR Data Processing in Futuristic Business Space
Premium
Businessman analysing trading  up trend line graph in bull market, Digital analytics data visualization, financial schedule Currency and Exchange Stock Chart for Finance and Economy Display
Futuristic Digital Dashboard with Dynamic Line Graphs
Financial Analysis with Percentage Shifts on Digital Trading Screen
Financial Analytics Concept with Candlestick Charts and Trend Lines
Healthcare Professionals Analyzing Digital Medical Data and Charts
Premium
Bangkok night cityscape and forex stock market hologram, candlesticks dynamics and statistics, bar chart with numbers. Concept of money investment, trading and profit
Digital Stock Market Analysis with Falling Trend Arrow
Power Lines and Cost Chart Interpolation at Dusk Suburb Landscape
Finance Analytics Dashboard with Graph Reports on Blue Grid
Fintech Data Visualization with Tranquil Seaside Background
Premium
Sketching with right hand plotting data in spiral notebook on office desk, with financial charts. Financial, data, analytics, workspace, professional, corporate, minimalist
Digital Financial Analytics with Dynamic Graphs and Code Interface
Innovative Financial Analytics Screen with Stock Chart on Glass
Digital Engagement and Analytics Visualization with Thumbs Up Icons
Interactive UI Dashboard with Analytical Data Visualizations
Premium
Businesswoman and businessman portraits, double exposure stock market candlesticks with lines, glowing forex diagrams. Concept of trading and consulting. Copy space
Healthcare Professional Examining Digital Data Analytics with Metrics Overlay
Neon Financial Dashboard Displaying Market Trend Lines, Monthly Bar Analytics, Data Overlay
Dynamic Financial Data Displayed Over Cityscape Background
Digital Interface with Numbers and Arrows in Motion
Abstract City Traffic Analytics with Data Overlay
Financial Analytics and Growth Over Comoros Flag Background
Premium
Earth sphere hologram with candlesticks and growing lines. Panoramic Bangkok cityscape at night. Concept of forex and investment, online trading and global market
Global Digital Interface with Financial Data Overlaid on Earth
Rugby Player and Digital Data Interface Concept
Futuristic Digital Interface Visualizing Data Processing Connections
Digital Processing Data with WOW Text Overlay
Premium
Businesswoman analyzing financial charts at office desk, with USD and EUR symbols, copy space. Financial, data, analytics, technology, modern, professional, corporate
Global Financial Data and Technology Visualization Concept
Cyber Network Shadows in a Futuristic Data Center
Futuristic Data Visualization with Binary Code and Graph Elements
Digital Trade Success with Floating Thumbs Up Among Green Charts
Premium
Using AI technology, data analytics is automated. Automation of artificial intelligence, big data, and business analytics. Touch screen dashboard report with KPI insights and sales,operational charts.
Digital Trading Desk with Line Graphs Representing Market Trends
Futuristic Digital Cybersecurity Shield with Global Network Grid
Digital Dashboard Displaying Rising Follower Count with Data Analytics
Digital Dashboard Display with Data Analytics and Graphs Overlay
Premium
Displaying translucent chart overlay in office, with candlestick bars, trend lines and birdhouses. Financial, data, analytics, productivity, modern, professional, corporate
Focused Female Professional Analyzing Financial Market Trends
Convergence of Agriculture and Data Analysis in Scenic Landscape
Man Holding VR Headset and Graphical Overlay in Home Office
Financial Analytics Overlay on Urban Skyline at Night
Premium
Displaying coastal skyline overlaying finance charts on rocky oceanfront boulevard, with mountain. Urban, skyline, waterfront, landscape, financial, data, analytical
Global Financial Markets and Urban skyline with Candlestick Charts
Holographic Stock Data and Financial Analysis Interface
Lock and Shield Icon on Graph Background Depicting Cybersecurity
Abstract Data Dashboard with Graphs and Charts
Premium
Trader analyzing data on virtual screen.Price graph and indicator. Stock market invest and crypto currency. Stock market and business investment.
Business Team Analyzing Financial Dashboard with Colorful Line, Bar and Pie Charts