1. Home > 
  2. Stock Photos > 
  3. Dynamic Financial Data Visualization with Numeric Overlays

Dynamic Financial Data Visualization with Numeric Overlays Image

Dynamic Financial Data Visualization with Numeric Overlays

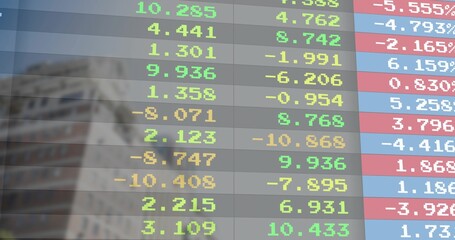
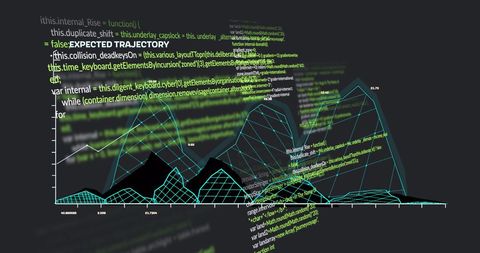
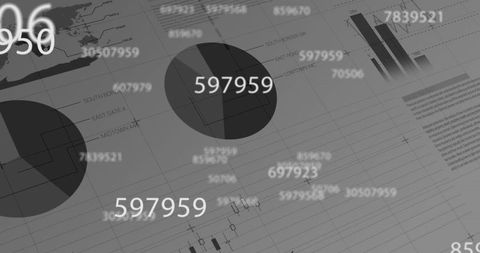
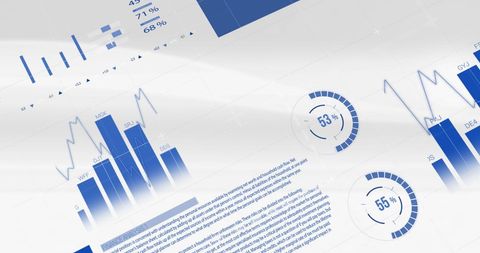
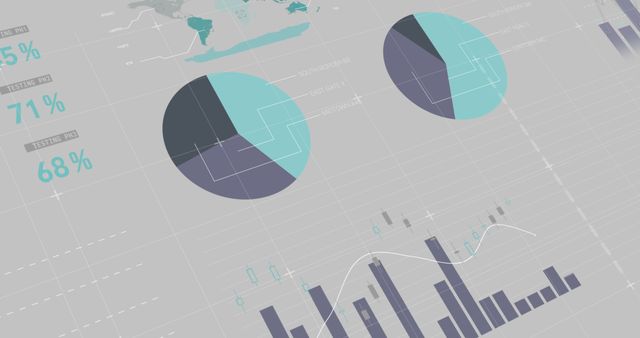
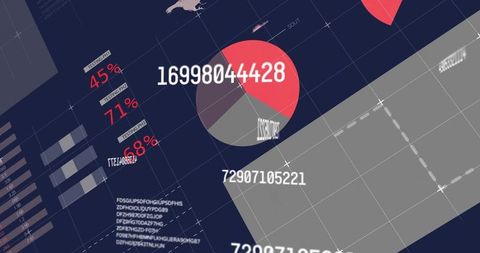
This image depicts a conceptual display of financial data visualization with a focus on numeric information layered over various data elements. Useful for illustrating themes around global finance, data analytics, business strategy, and economic research. Ideal for use in presentations, reports, or websites related to financial markets and economic analysis.

Powered by Adobe logo
Business growth concept with upward arrows and candlestick chart graphics overlaying hands typing on laptop in creative digital background. - Powered by AdobeDisplaying scale model house with red roof on table, showing translucent market data overlay - Powered by AdobeTrading floor concept rendered with abstract charts and blinking numerical overlays - Powered by AdobeThis image showcases a hand typing on a keyboard with an overlay of graphs and charts, symbolizing data analysis and business growth in a modern workspace. Copula - Powered by AdobeIlluminated digital stock market graph with dynamic orange trend line and blurred financial data on a high-resolution electronic display screen - Powered by Adobe

Credit Photo

If you would like to credit the Photo, here are some ways you can do so

Free (free of charge)

Free for personal and commercial use.

Author: Awesome Content

Similar Free Stock Images

Loading...
Digital Job Application Form on Electronic Interface
Premium
Abstract financial chart overlayed with digital world map
Digital Currency Market with Floating Credit Cards
Advanced Data Processing and Visualization on Digital Interface
Futuristic Digital Analytics Over 3D Cityscape Background
Data Analytics with World Map and Stock Market Graph Icons
Abstract Digital Data Interface on Blue Background
Premium
Futuristic global financial network visualization. Glowing green data streams flow across a world map. Stock charts, graphs, and numeric data overlay the dark background.
Premium
vibrant display of financial data analytics, with various types of graphs and numerical data overlaid on a digital interface or motherboard
Financial Data Analysis with Digital Interface Icons on Dark Background
Futuristic Digital Interface with Global Charts and Data
Business Team Analyzing Data with Virtual Interface Displays
Premium
Futuristic digital oil pump jack overlay with glowing numerical data and cityscape at dusk
Global Financial Data Processing Visualization in Grid Format
Abstract Data Visualizations and Digital Analytics Concept
Abstract Business Data Analytics and Statistics Visualization
Premium
A high-tech global finance scene
Digital Financial Data Analysis with Charts and Graphs
Abstract Digital Background with Search Engine Interface
Visualizing Big Data Analysis with Interactive Graphs and Charts
Data Processing and Artificial Intelligence Digital Concept
Premium
Candlestick chart displaying market trends in trading screen, with red line, code and data overlays
Global Technology with Holographic Data Interface
Digital Financial Dashboard with Global Data Analysis Concept
Futuristic Data Visualization with Mathematical Equations and Graphs
Dynamic Digital Interface with Changing Financial Statistics
Premium
Stacks of coins with overlaid graph, symbolizing finance, investment, and market trends in a golden, reflective setting.
Analyzing Complex Data Visualizations in Technology and Finance
Global Connectivity Concept with Digital User Profiles
Futuristic Digital Dashboard with Data Analytics Interface
Futuristic Digital Finance Dashboard with Visualized Code Activity
Premium
Digital representation of a bank building with financial data overlay, set on a vibrant digital background, concept of fintech. Generative AI
Digital Numbers Floating in Abstract Network Grid
Futuristic Digital Dashboard with Bioinformatics Data Projections
Global Financial Data Analysis on Digital Interface
Global Financial Data Analysis Over High-Speed Cityscape
Data Processing and Analysis Visualization on Black Background
Abstract Data and Statistics on Transparent Business Screen
Premium
Multiple stock graphs and numerical data overlaid on a cityscape, representing the finance and economy
Cybersecurity Concepts with Global Digital Data Visualizations
Social Media Engagement Overlaid on Statistical Data
Premium
A businesswoman working on financial reports with a calculator, featuring a digital overlay of growth charts and numerical data
Abstract Financial Analytics Interface with World Map and Data Charts
Digital Data Visualization Overlay with Graphs and Charts
Abstract Data Visualization and Infographics Interface
Global Notification Alerts on Digital World Map
Premium
Abstract Financial Data Graph Overlay
Abstract Financial Data Interface with Envelopes Symbolizing Digital Communication
Abstract Financial Data Overlay on Cityscape at Dusk
Digital Financial Data Analysis on Abstract Interface
Dynamic Financial Data Visualization on Digital Interface
Digital Boarding Passes with QR Codes and Code Overlay
Digital Financial Data Insights on Dark Background
Digital Financial Data Processing Concept with Charts
Digital Global Analytics Interface with Infographics and Data Visualization
Global Financial Data Visualizations with Charts and World Map
Digital Data Analytics with Interactive Charts and Global Visualization
Dynamic Digital Finance Interface with Statistical Data Displayed
Digital Interface with Global Financial Data and Graphs
Premium
Abstract coin icon with line graph overlay.
Global Business Network and Collaboration Conceptual Design
Innovative Digital Dashboard Showing Data Analytics
Futuristic Environmental Data Interface with Iconography
Technology Concept with Seamless Integration of Digital Graphs and Transmission Towers
Digital Data Streams Over World Map Global Connections Concept
Premium
Abstract coin icon with line graph overlay.
Premium
A futuristic financial data visualization showing a glowing blue digital interface with stock market candlestick charts
Premium
Digital interface displays data visualizations including charts graphs and numerical information.
Digital Interface Showing Stock Market Data Analysis
Futuristic Digital Interface Displaying Data and Graphs
Business Overview with Infographics and Financial Data Analytics
Digital Data Flow and Virtual Interface Visualization
Invigorated Analyst Evaluating Complex Financial Data Visualizations
Abstract Financial Data Overlay
Holographic Financial Analysis Display with Graphs and Data
Data Analytics Interface with Code and Graphs
Dynamic Display of Stock Market Data and Financial Analytics
Digital Display of Global Financial Data Processing
Futuristic Virtual Data Analysis and Analytics Visualization
Abstract Financial Data background with Charts and Emails
Premium
vibrant display of financial data analytics, with various types of graphs and numerical data overlaid on a digital interface or motherboard
Futuristic Data Flow with Digital Numbers Over Cityscape
Futuristic Financial Data Visualization Against Urban Skyline
AI Chip Highlights Interaction in a Digital Code Environment
Global Data Collection with Dynamic Graphs and Analytics
Premium
A close-up of a hand with a stylus interacting with a digital stock market chart. The overlay of candlestick graphs, buy and sell signals and numerical data.
Premium
A modern interactive display showcasing business growth trends with vibrant statistics overlays on a sleek keyboard, representing technology and finance synergy. Copula
Financial Data Processing with Global Business Interface Graphs
Visual Analytics and Big Data Shaping Global Business Decisions
Digital Data Analytics with Advanced Interface Design
Digital City Layout with Data Processing Visualization
Premium
3D pie chart, world map overlay
Futuristic Digital Interface Abstract with Graphs and Charts
Social Media Notifications Overlay Showing Subscribed, Liked, Friend Added Alerts
Futuristic Digital City with Moving Data Visualizations
Digital Data Processing with Global Connections
Digital Data Processing for Financial Analysis Concept
Dynamic Digital Data Processing Interface on Black Background
Digital Composite of Diverse Financial Charts and Graphs
Financial Data Analytics with Virtual Graphs and Charts
Abstract Digital Interface with Charts and Graphs Overlay
Stressed Man Balancing Office Files Amid Digital Data
Futuristic Data Visualization Interface with Graphs and World Map
Digital Data Processing on Black Background Highlighting Code
Digital Interface with Financial Analytics and Data Processing
Premium
The image depicts several stacks of coins in focus, overlayed with a dynamic digital bar chart, symbolizing economic growth amidst a blurred office setting.
Digital Interface Displaying Global Finance Data Charts
Premium
Illuminated various financial charts and graphs overlaying a blurred background, showcasing data analysis and trends.
Financial Data Processing with Digital Analytics Overlay
Financial Data and Analytics Visualization in Digital Interface
Financial Data Processing with Envelopes and Charts
Futuristic Financial Data Interface Representation
Premium
Chicago skyline with futuristic holographic overlay, digital graphics concept on water and sky background. Double exposure
Premium
A digital graphic depicts a rising arrow graph overlaid on a dark blue background with the number 7890 prominently displayed
Data Processing Graphics on Blue Digital Background
Financial Data Analysis with Digital Charts and Graphs on Dark Background
Digital Interface with Data Visualization and Globe Overlays
Digital Financial Analytics with Real-time Data Processing
Premium
A blue and green line graph with numerical labels overlaid on a world map background illustration
Social Media Like Icons and Statistics Interface
Business Charts and Data Visualization in Team Meeting Environment
Digital Financial Data Overlay on Payment Terminal Background
Data Analysis with Futuristic AI Dashboard Interface
Premium
American flag with TAR% overlaid
Displaying digital analytics dashboard with large numeric data and pie chart on navy grid