- Home >
- Stock Photos >
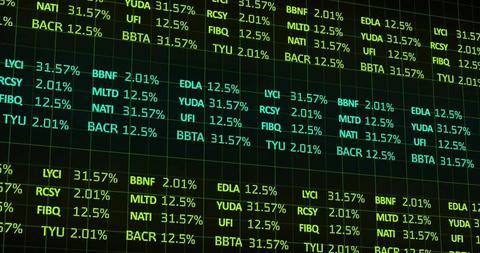
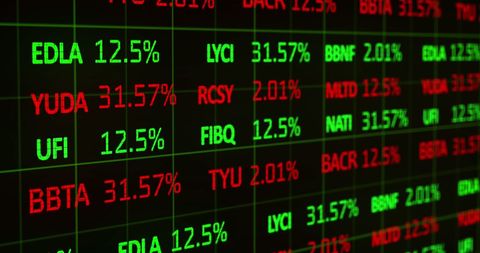
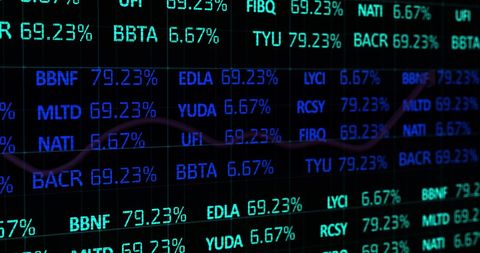
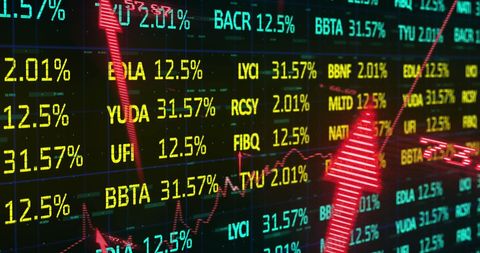
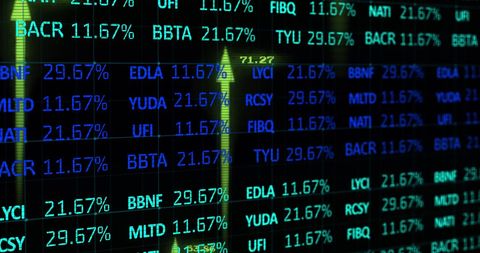
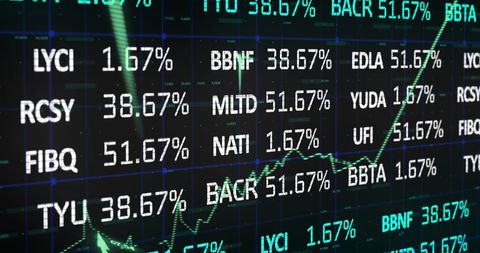
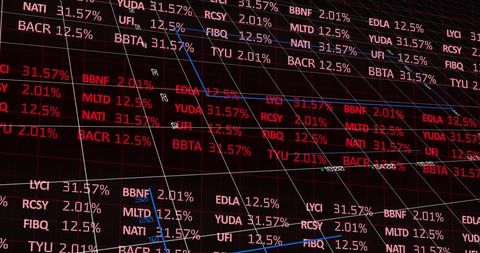
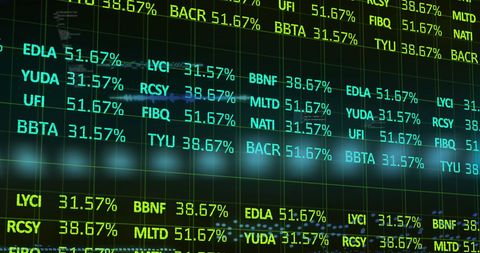
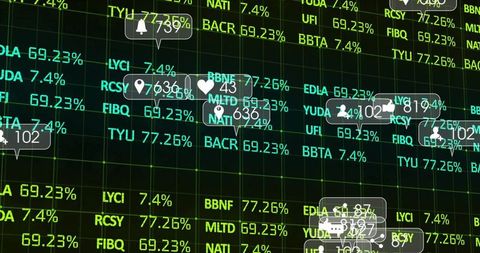
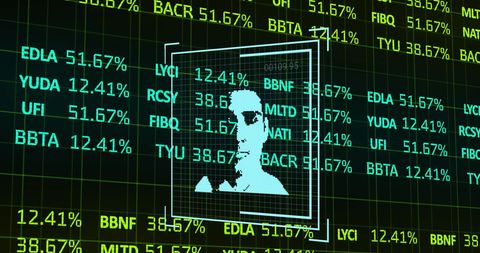
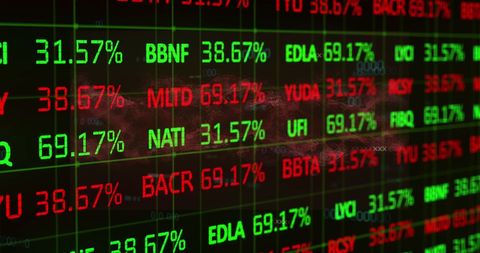
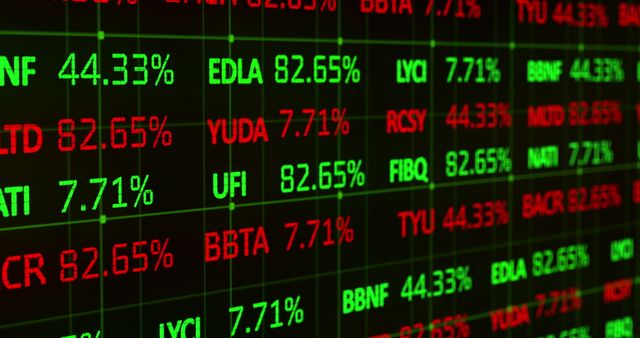
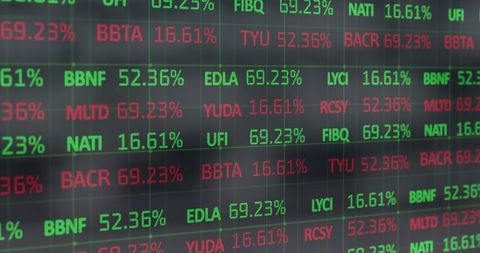
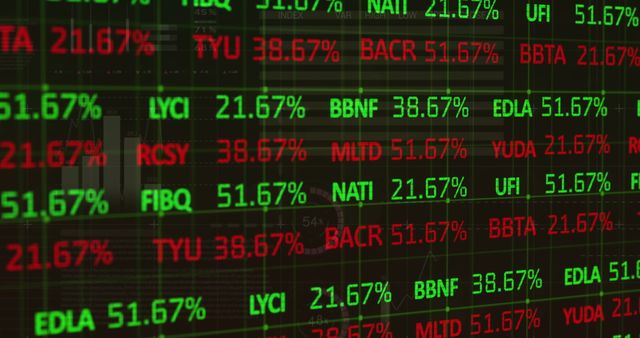
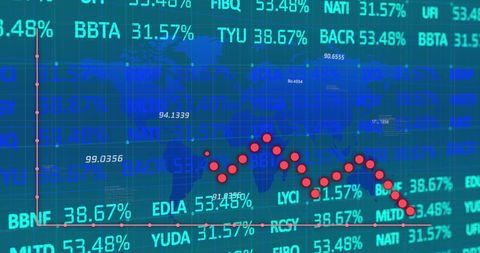
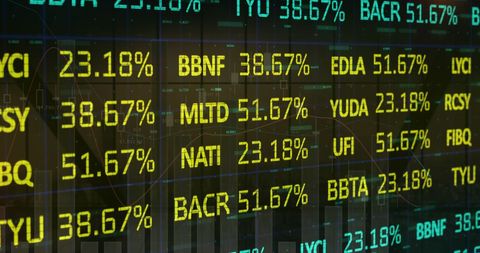
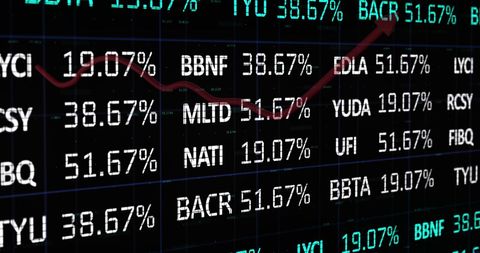
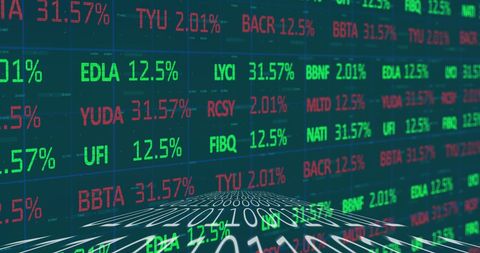
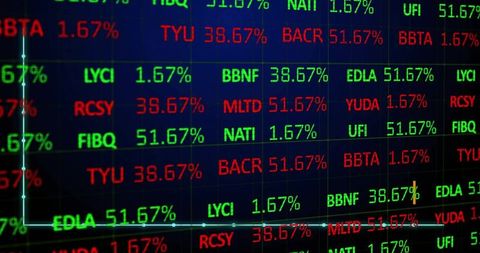
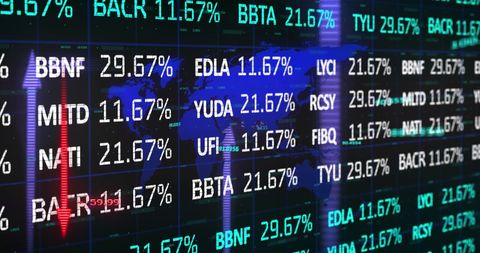
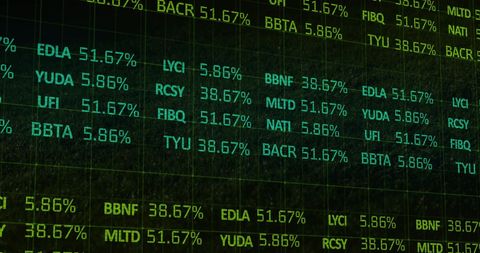
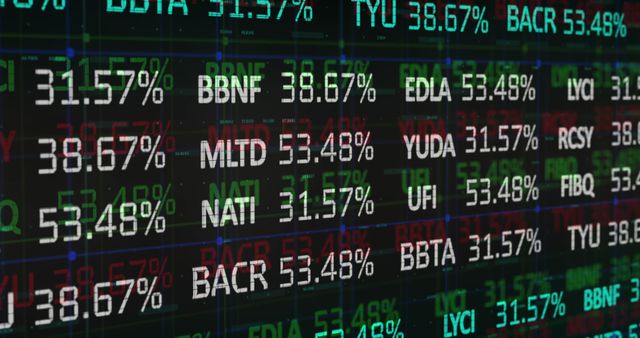
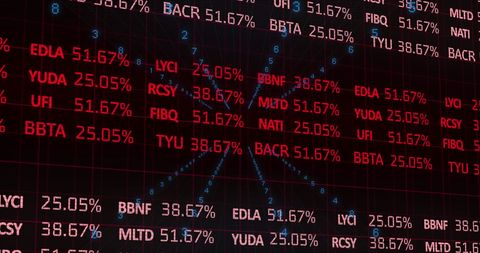
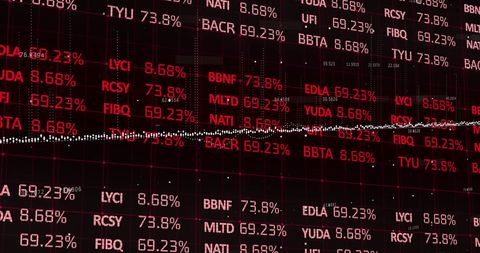
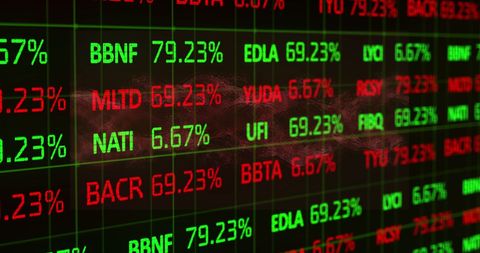
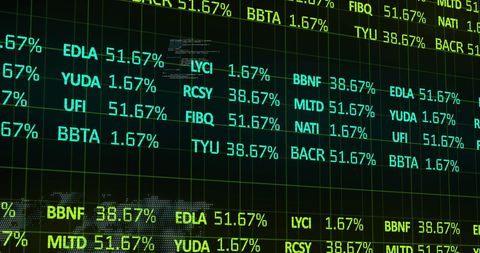
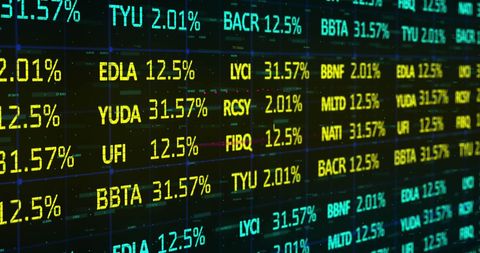
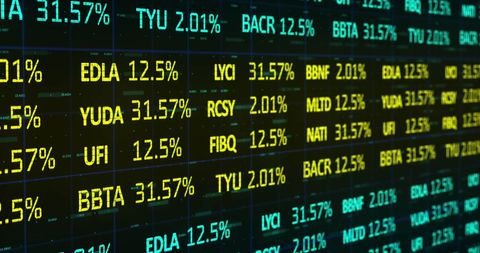
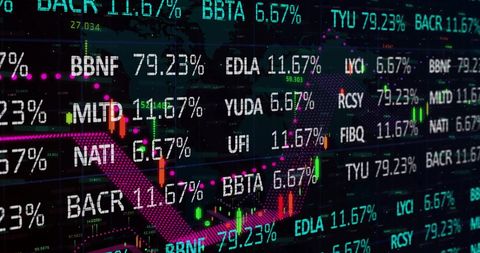
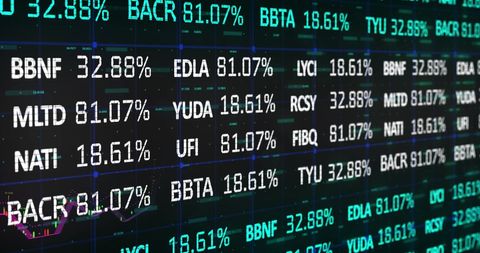
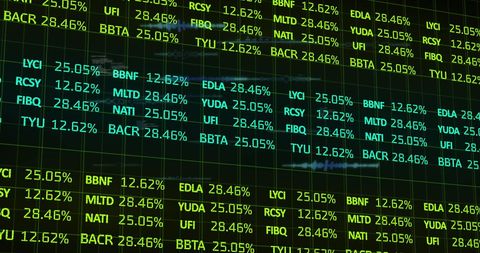
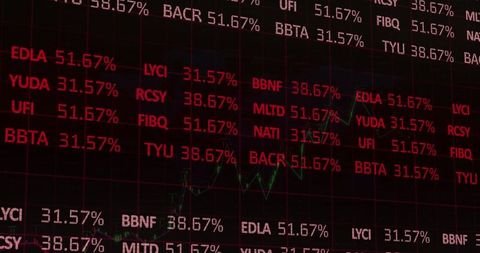
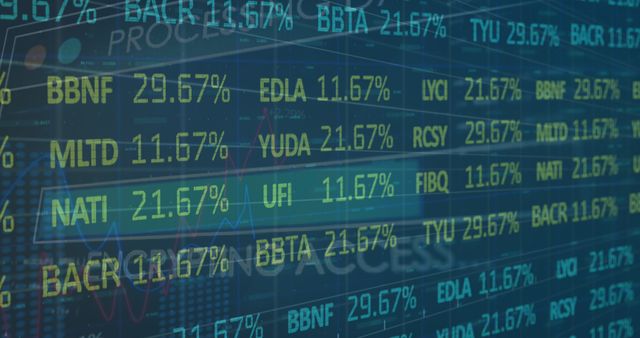
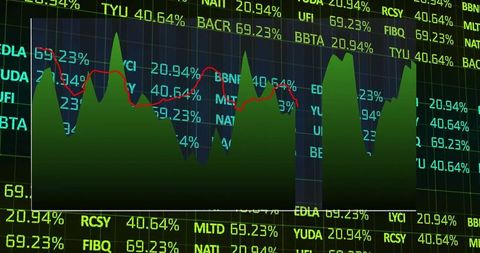
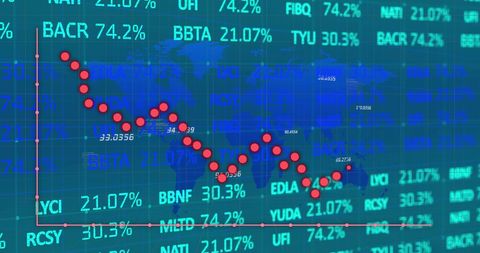
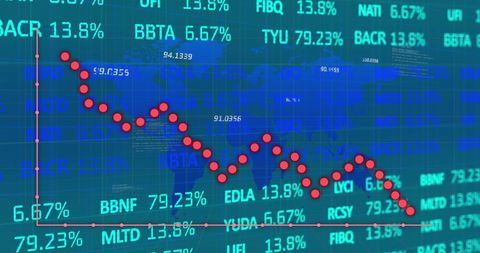
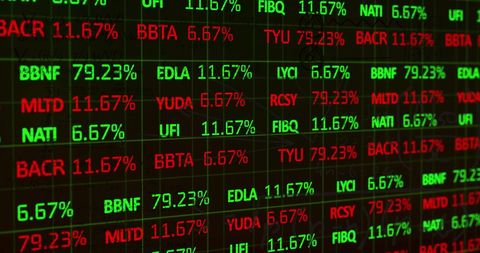
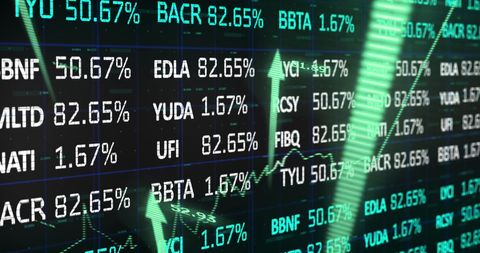
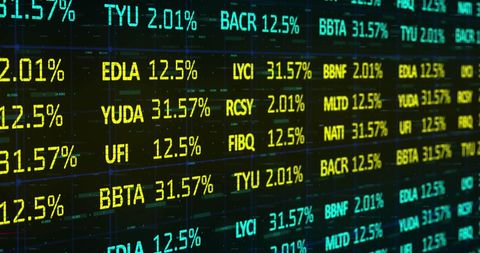
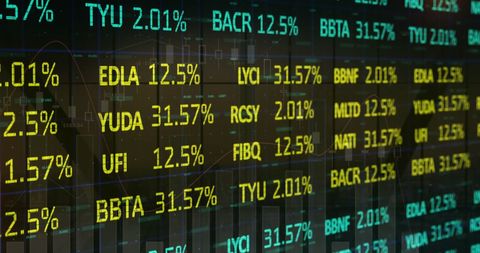
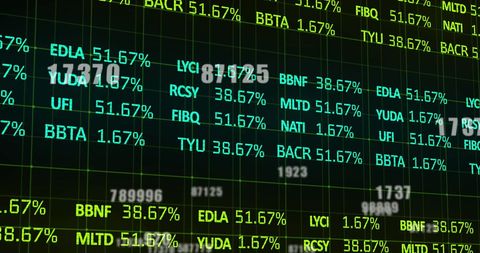
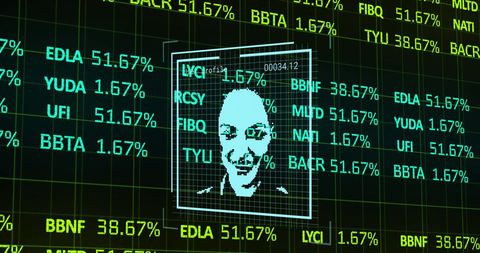
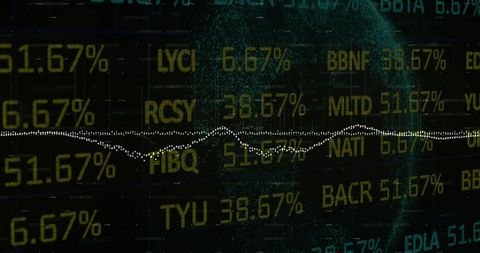
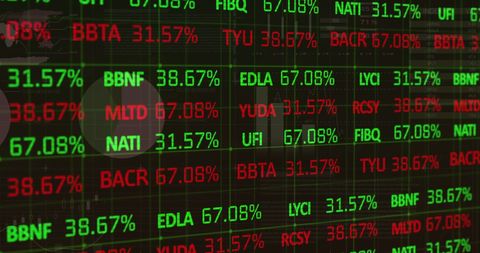
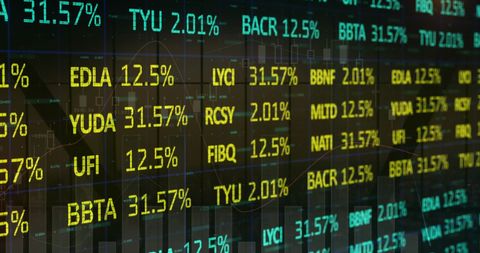
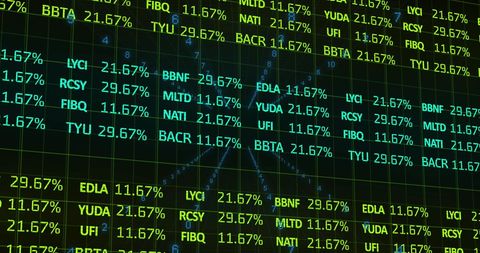
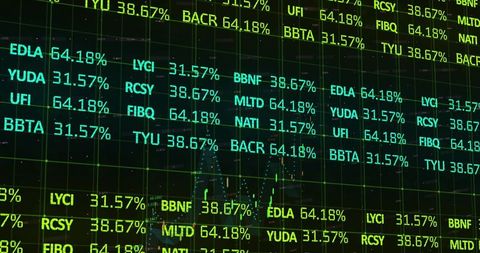
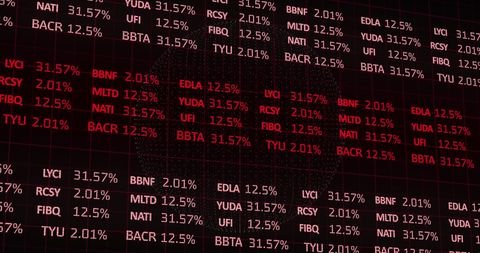
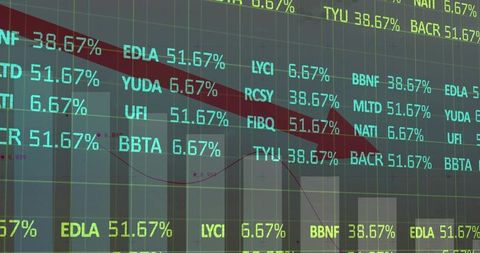
- Dynamic Financial Data Visualization with Stock Market Indicators
Dynamic Financial Data Visualization with Stock Market Indicators Image
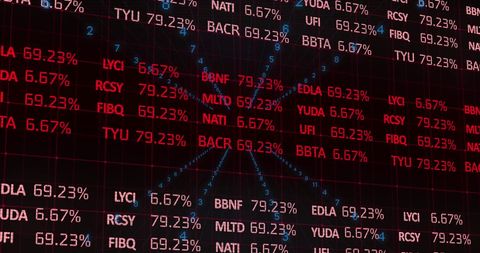
This image shows colorful financial data and stock market symbols set against a dark background, representing dynamic changes in economic activity. Excellent for financial services, investment companies, and economic analysis reports to visually describe market trends and data-driven decision making.

downloads
Tags:
More
Credit Photo
If you would like to credit the Photo, here are some ways you can do so
Text Link
photo Link
<span class="text-link">
<span>
<a target="_blank" href=https://pikwizard.com/photo/dynamic-financial-data-visualization-with-stock-market-indicators/26bbabce94d5a7316eaafe16385486f6/>PikWizard</a>
</span>
</span>
<span class="image-link">
<span
style="margin: 0 0 20px 0; display: inline-block; vertical-align: middle; width: 100%;"
>
<a
target="_blank"
href="https://pikwizard.com/photo/dynamic-financial-data-visualization-with-stock-market-indicators/26bbabce94d5a7316eaafe16385486f6/"
style="text-decoration: none; font-size: 10px; margin: 0;"
>
<img src="https://pikwizard.com/pw/medium/26bbabce94d5a7316eaafe16385486f6.jpg" style="margin: 0; width: 100%;" alt="" />
<p style="font-size: 12px; margin: 0;">PikWizard</p>
</a>
</span>
</span>
Free (free of charge)
Free for personal and commercial use.
Author: Creative Art