- Home >
- Stock Photos >
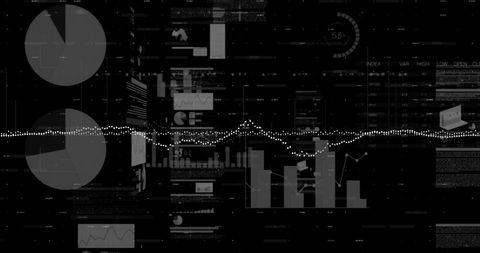
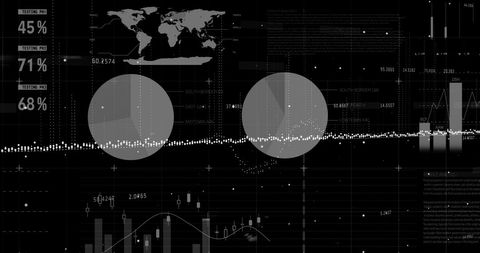
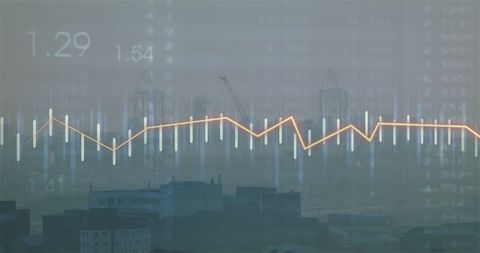
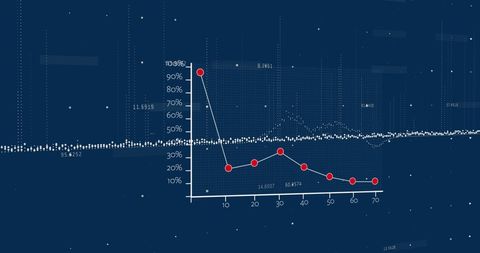
- Dynamic Financial Data Visualization with Tech Concept Background
Dynamic Financial Data Visualization with Tech Concept Background Image

Creative portrayal of financial data through a chart-like design emphasizes advancements in global business analytics. The image’s rolling numerical displays suggest processing or analysis, suitable for illustrating concepts of finance, technology, or digital business in presentations, websites, or reports.

downloads
Tags:
More
Credit Photo
If you would like to credit the Photo, here are some ways you can do so
Text Link
photo Link
<span class="text-link">
<span>
<a target="_blank" href=https://pikwizard.com/photo/dynamic-financial-data-visualization-with-tech-concept-background/206eb8fb9b2970fee0dd424cbe36f736/>PikWizard</a>
</span>
</span>
<span class="image-link">
<span
style="margin: 0 0 20px 0; display: inline-block; vertical-align: middle; width: 100%;"
>
<a
target="_blank"
href="https://pikwizard.com/photo/dynamic-financial-data-visualization-with-tech-concept-background/206eb8fb9b2970fee0dd424cbe36f736/"
style="text-decoration: none; font-size: 10px; margin: 0;"
>
<img src="https://pikwizard.com/pw/medium/206eb8fb9b2970fee0dd424cbe36f736.jpg" style="margin: 0; width: 100%;" alt="" />
<p style="font-size: 12px; margin: 0;">PikWizard</p>
</a>
</span>
</span>
Free (free of charge)
Free for personal and commercial use.
Author: People Creations