
- Home >
- Stock Photos >
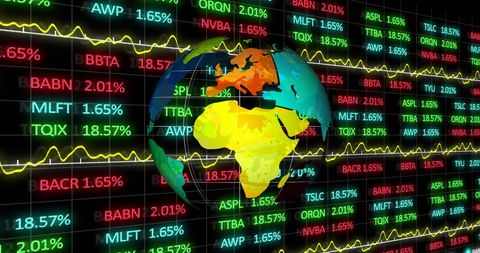
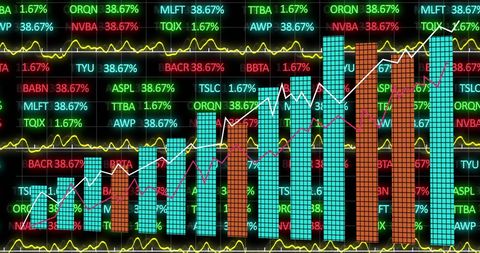
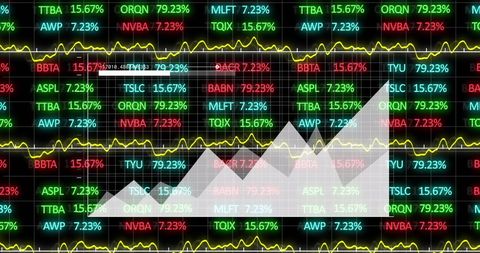
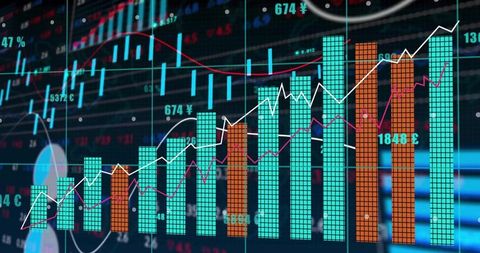
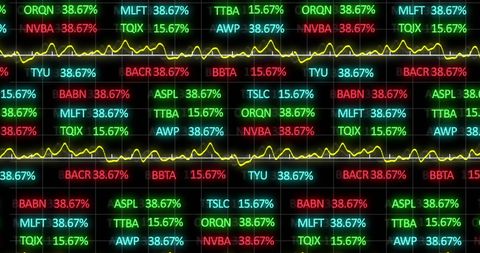
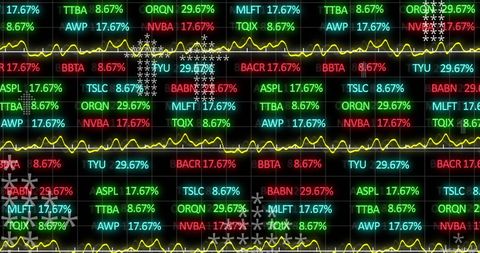
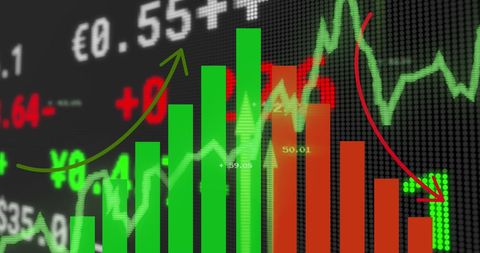
- Dynamic Financial Data Visualizations with Global Statistics
Dynamic Financial Data Visualizations with Global Statistics Image
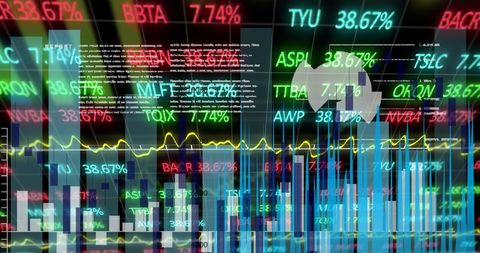
Online platforms and financial presentations frequently use visuals that include dynamic graphics and numerical data to communicate economic trends. Useful in business reports, investment analysis, and educational resources related to finance and statistics for its professional depiction of complex financial analytics.
Powered by 


downloads
Tags:
More
Credit Photo
If you would like to credit the Photo, here are some ways you can do so
Text Link
photo Link
<span class="text-link">
<span>
<a target="_blank" href=https://pikwizard.com/photo/dynamic-financial-data-visualizations-with-global-statistics/889f0734493ffdb5427091ff8b4c51c1/>PikWizard</a>
</span>
</span>
<span class="image-link">
<span
style="margin: 0 0 20px 0; display: inline-block; vertical-align: middle; width: 100%;"
>
<a
target="_blank"
href="https://pikwizard.com/photo/dynamic-financial-data-visualizations-with-global-statistics/889f0734493ffdb5427091ff8b4c51c1/"
style="text-decoration: none; font-size: 10px; margin: 0;"
>
<img src="https://pikwizard.com/pw/medium/889f0734493ffdb5427091ff8b4c51c1.jpg" style="margin: 0; width: 100%;" alt="" />
<p style="font-size: 12px; margin: 0;">PikWizard</p>
</a>
</span>
</span>
Free (free of charge)
Free for personal and commercial use.
Author: Creative Art
Similar Free Stock Images

Premium


Premium

Premium


Premium


Premium

Premium

Premium


Premium


Premium


Premium


Premium

Premium


Premium


Premium

Premium


Premium


Premium


Premium


Premium

AI


Premium


Premium


Premium


Premium


Premium


Premium


Explore More Free Stock Images