1. Home > 
  2. Stock Photos > 
  3. Dynamic Financial Data Visualized on Dark Screen

Dynamic Financial Data Visualized on Dark Screen Image

Dynamic Financial Data Visualized on Dark Screen

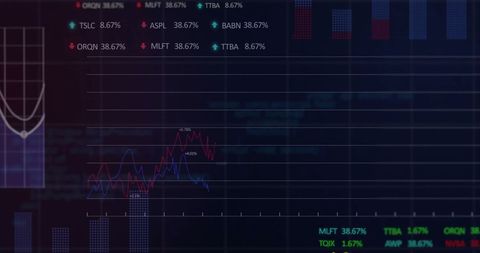
Visual representation of financial data and trends. Useful for illustrating articles or presentations on business analytics, stock market behavior, global finance, and investment strategies.

Powered by Adobe logo
Global finance concept with stacked coins, digital world map and rising bar charts symbolizing economic growth, currency markets, international investment and modern financial analytics. - Powered by AdobeCloud computing financial investment technology with digital glowing network data - Powered by AdobeDigital stock market financial growth chart with data analysis. - Powered by AdobeBusinessman indicates growth trend with rising graph data showing business success and financial profit using innovative modern technology - Powered by AdobeDigital network connecting abstract city skyline with growth chart representing financial data analytics and business intelligence - Powered by Adobe

Credit Photo

If you would like to credit the Photo, here are some ways you can do so

Free (free of charge)

Free for personal and commercial use.

Author: Creative Art

Similar Free Stock Images

Dynamic Financial Data Display in Digital Space
Premium
Businessman using laptop with digital bank icon. Concept of online banking fintech digital transformation in financial tech, cyber security, data protection, secure transaction, global economy,
Digital Financial Data Interface with Analytics
Dynamic Financial Data Graphs Networking in Global Business
Financial Data Streaming with Arrows Over Graphic Indicators
World Map with Falling Line Graphs Indicating Global Economic Decline
Premium
Businessman working with a digital tablet displaying holographic business growth charts and data analysis. Professional executive interacting with futuristic technology for financial success and marke
Financial Visualization Overlooking Urban Cityscape
Rising Digital Graph and Data Visualizations on Black Background
Digital Finance: Modern Stock Market Analysis Display
Digital Financial Display with Graphs and Data Analysis
Premium
Wireframe architecture of a grand financial institution or government building with glowing digital data visualization overlays.
Digital Financial Data Processing Interface on Red Background
Data Security with Tech Bar Graph Overlay
Analyzing Data Trends on Digital Graph Interface
Dynamic Financial Growth Digital Chart Display
Premium
Digital world map illustration with glowing connections and financial symbols for global commerce
Holographic Charts with Social Media Notifications
Digital Finance Network with User Profiles and Graphs
Colorful Bar Graph with Data Overlay on Black Background
Dynamic Data Visualization with Financial Charts and 3D Elements
Premium
Abstract digital data science and tech innovation concept. glowing atom core, financial charts, and diverse icons represent business, research, global digital networks, modern solution.
Dynamic Financial Data Against Urban Skyline
Digital Chart Display Financial Data Analysis Background Effects
Holographic Financial Stock Market Analysis Visualization
Global Financial Data Processing with Digital Interface Elements
Premium
Financial Growth Chart Showing Positive Trend
Dynamic Financial Data Overlaid on Grid Background
Financial Data Analysis with Growing Stock Trends
Abstract Financial Data Processing and Analysis Interface
Dynamic Financial Stock Market Analysis Display
Colorful Stock Market Display with Graphs and Tickers on Blue Background
Dynamic Stock Market Graphs Indicating Financial Trends
Premium
Retail store displaying futuristic data analytics interface
Digital Financial Data and Global Business Analytics
Digital Stock Market Trends and Financial Growth Analysis
Dynamic Digital Data Analysis on Elevated Grid
Financial Data Graph Rendering Global Market Trends
Premium
Diverse team analyzing financial data in modern office
Financial Stock Market Data Analysis on Digital Interface
Dynamic Stock Market Analytics Display on Blue Background
Fluctuating Digital Stock Market Data Chart
Colorful Data Visualization Graphs on Digital Grid
Premium
Bull market financial technology growth in network data center
Digital Financial Data Analysis with Graphs and Stock Market Trends
Financial Data Processing with Digital Patterns for Global Business
Digital Financial Data Overlay on Urban Street Scene
Dynamic Financial Data Chart Display with Graphical Analysis
Premium
Abstract glowing lines representing financial data flow and economic analytics, perfect for fintech and corporate design
Financial Data Processing with Rising Graphs
Dynamic Statistical Data Analysis on Digital Grid Network
Rising Financial Data Graph on Digital Grid Background
Financial Data Processing with Graphs and Charts Overlay
Premium
Digital financial growth chart with upward arrow showing success
Abstract Digital Stock Market Interface with Graphs and Data
Digital Cityscape with Financial Data Overlay
Dynamic Stock Market Analysis Concept Artwork
Dynamic Financial Graphs Overlaying Modern Cityscape
Premium
Global financial market data overlaying a modern futuristic city skyline at night, symbolizing economic growth, business success, and technological advancement in urban development
Digital Data Processing with Technology Interface on Blue Background
Financial Graph with Data Analysis and Market Statistics
Dynamic Graphic of Financial Data Displayed on Graph
Digital Finance Data Overlaying Futuristic Cityscape
Dynamic Digital Stock Market Ticker with Growing Graph Trends
Financial Data Displayed Over City Skyline with Rising Graphs
Premium
Digital tax management with technology and investment optimization with modern data solutions
Financial Data Visualization with Cityscape Overlay
Digital Interface with Data Graphs and Charts
Financial Data Flow against Urban Skyline Backdrop
Dynamic Green Stock Chart on Digital Grid Background
Premium
Businessman using smartphone with holographic financial data and stock market analytics
Financial Data Charts in Shimmering Blue Digital Space
Digital Ruble Symbol with Data Graph Overlay
Financial Data Display in Digital Grid Design
Digital Financial Data with Graph and Grid Patterns
Premium
Transparent or png stock market investment trading graph growth.Trade business analytics graph and financial chart.
Digital Financial Data Analysis with Infographics and Charts
Data Analytics Graphs on Digital Interface Background
Dynamic Business Data and Cityscape Visualization
Digital Data Visualization with Trend Lines and Percentage Changes
Premium
A corporate data management expert analyzing real-time financial and business data on a large digital screen, showcasing market trends, analytics, and strategic insights in a modern office
Financial Graphs with Social Media Analytics on Digital Chart
Dynamic Financial Data Visualization on Digital Grid Background
Futuristic Keyboard Analytics Display with Digital Graphs and Numbers
Digital Data Visualization and Analysis Interface
Premium
Confident businessman analyzing upward trending financial data on a futuristic holographic display, driving business growth and success
Financial Data Analysis Vibrant Graphs on Blue Background
Dynamic Stock Market Data Analysis With Graphs and Percentages
Financial Data Analysis with Interactive Graphs
Stock Market Analysis with Graphs and Trading Data
Premium
Data center with a blurred image of the data. Video of financial information server with realistic visualization. International commerce and financial management room with lifestyle interfaces.
Dynamic Stock Market Chart with Fluctuating Trends and Data Points
Digital Interface Visualizing DNA and Data Patterns
Dynamic Stock Market Trends with Graphs on Digital Display
Rising Stock Market Trends and Chart Analysis
Digital DNA Strand Visualization on Modern Interface Background
Financial Data Visualization Over Futuristic Cityscape
Premium
Professional analyzing global business analytics data with futuristic interface
Financial Data Charts with World Map on Blue Digital Background
Digital Data Processing with Futuristic Interface and Loading Bar
Dynamic Financial Graphs Illustrating Market Trends
Dynamic Stock Market Data Visualization on Digital Screen
Premium
Investment Growth Analysis Modern Financial Dashboard Shows Global Economic Trends
Analyzing Accelerating Data Trends on Grid with Tech Insights
Financial Data Line Graph on Digital Display
Abstract Digital Interface for Medical Data Processing
Dynamic Financial Charts and Graphs Indicating Market Trends
Premium
Interactive Global Financial Data Analysis Interface with Graph Trends on Touchscreen.
Rising Graphs and Interactive Financial Data Analytics Background
Dynamic Forex Trading Graphs with Increasing Numbers
Financial Data Analysis in Digital Interface with Graphs
Financial Growth Graph and Data Analytics Representation
Premium
Glowing globe representing global finance and technology, showcasing interconnected data and markets
Abstract Digital Charts with Social Media Metrics Rising
Holographic Financial Data Visualization with Stock Trends
Dynamic Financial Graphs and Data Analysis Interface
Abstract Digital Stock Market Analysis with Graphs
Premium
glowing lines chart financial data against a backdrop of a shipping port with containers and cranes, representing global logistics, supply chain and business analytics
Analyzing Financial Data on Digital World Map Background
Cityscape with Digital Stock Market Graphs and Statistics
Digital Financial Data Analysis on Grid Framework
Digital Financial Data Visualization on Dark Screen
Premium
Businessman interacting with futuristic digital dashboard with global data analytics financial charts, for business intelligence, strategic planning, market research for comprehensive
Digital Visualization of Global Networking with Statistical Graphs