
- Home >
- Stock Photos >
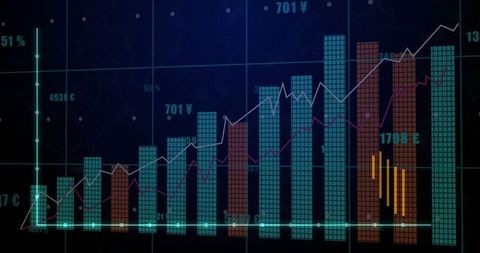
- Dynamic Financial Data Visualized Over Warehouse Background
Dynamic Financial Data Visualized Over Warehouse Background Image

This graphical representation perfectly merges data visualization with an industrial warehouse setting, enhancing themes of logistics and efficiency. Suitable for use in reports, presentations, and articles discussing financial trends, industry data analysis, or economic performance.
Powered by  - Get 15% off with code: PIKWIZARD15


downloads
Tags:
More
Credit Photo
If you would like to credit the Photo, here are some ways you can do so
Text Link
photo Link
<span class="text-link">
<span>
<a target="_blank" href=https://pikwizard.com/photo/dynamic-financial-data-visualized-over-warehouse-background/f11237a975e650078bb10a4274af6556/>PikWizard</a>
</span>
</span>
<span class="image-link">
<span
style="margin: 0 0 20px 0; display: inline-block; vertical-align: middle; width: 100%;"
>
<a
target="_blank"
href="https://pikwizard.com/photo/dynamic-financial-data-visualized-over-warehouse-background/f11237a975e650078bb10a4274af6556/"
style="text-decoration: none; font-size: 10px; margin: 0;"
>
<img src="https://pikwizard.com/pw/medium/f11237a975e650078bb10a4274af6556.jpg" style="margin: 0; width: 100%;" alt="" />
<p style="font-size: 12px; margin: 0;">PikWizard</p>
</a>
</span>
</span>
Free (free of charge)
Free for personal and commercial use.
Author: Authentic Images
Similar Free Stock Images

Premium


Premium

Premium


Premium


Premium


Premium


Premium

Premium

Premium


Premium


Premium

Premium


Premium


Premium


Premium


Premium


Premium


Premium


Premium

Premium


Premium


Premium


Premium


Premium


Premium

Explore More Free Stock Images