
- Home >
- Stock Photos >
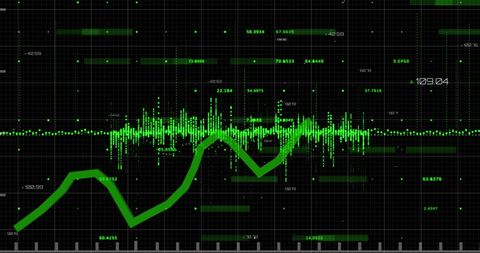
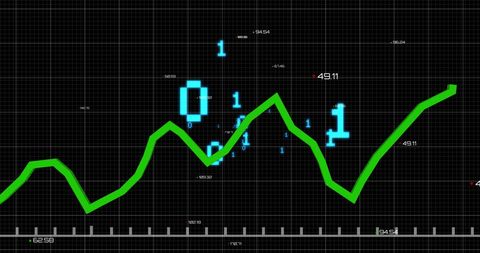
- Dynamic Financial Data Visuals on Futuristic Neon Interface
Dynamic Financial Data Visuals on Futuristic Neon Interface Image

Digital waves rise and dip against a dark grid showcasing vibrant financial analytics ideal for technology-focused presentations or articles. The vibrant colors highlight data trends effectively, making it suitable for data science education materials and investment-related advertisements.
Powered by 


downloads
Tags:
More
Credit Photo
If you would like to credit the Photo, here are some ways you can do so
Text Link
photo Link
<span class="text-link">
<span>
<a target="_blank" href=https://pikwizard.com/photo/dynamic-financial-data-visuals-on-futuristic-neon-interface/b02222bbafbaf5a740ef355c092a28fc/>PikWizard</a>
</span>
</span>
<span class="image-link">
<span
style="margin: 0 0 20px 0; display: inline-block; vertical-align: middle; width: 100%;"
>
<a
target="_blank"
href="https://pikwizard.com/photo/dynamic-financial-data-visuals-on-futuristic-neon-interface/b02222bbafbaf5a740ef355c092a28fc/"
style="text-decoration: none; font-size: 10px; margin: 0;"
>
<img src="https://pikwizard.com/pw/medium/b02222bbafbaf5a740ef355c092a28fc.jpg" style="margin: 0; width: 100%;" alt="" />
<p style="font-size: 12px; margin: 0;">PikWizard</p>
</a>
</span>
</span>
Free (free of charge)
Free for personal and commercial use.
Author: Creative Art
Similar Free Stock Images

Premium


Premium


Premium


Premium


Premium


Premium

Premium


Premium


Premium

Premium


Premium


Premium


Premium


Premium


Premium

Premium


Premium


Premium


AI

Premium


Premium


Premium


Premium


Premium


Premium


Premium


Explore More Free Stock Images