
- Home >
- Stock Photos >
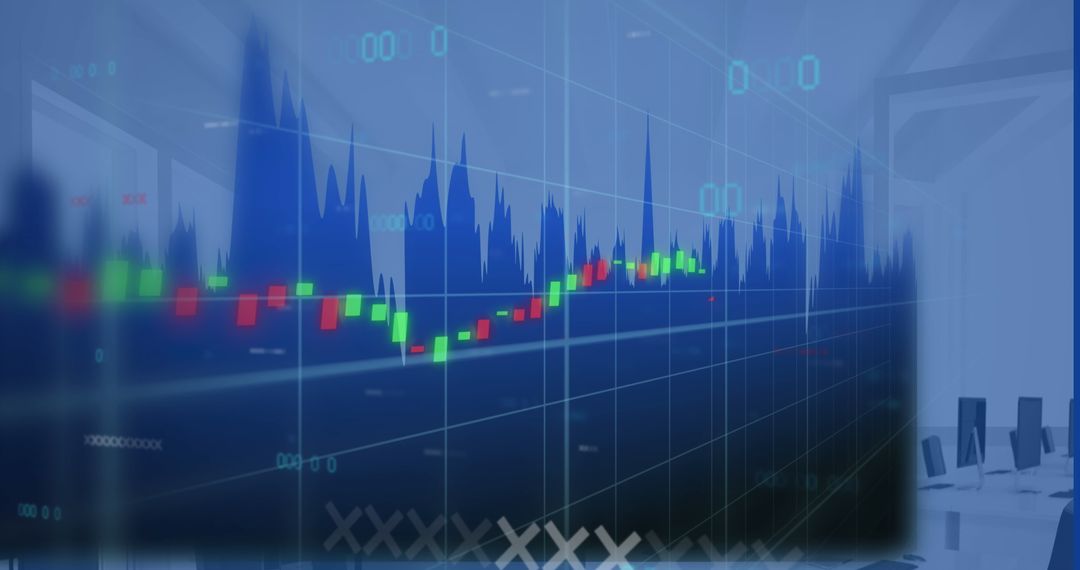
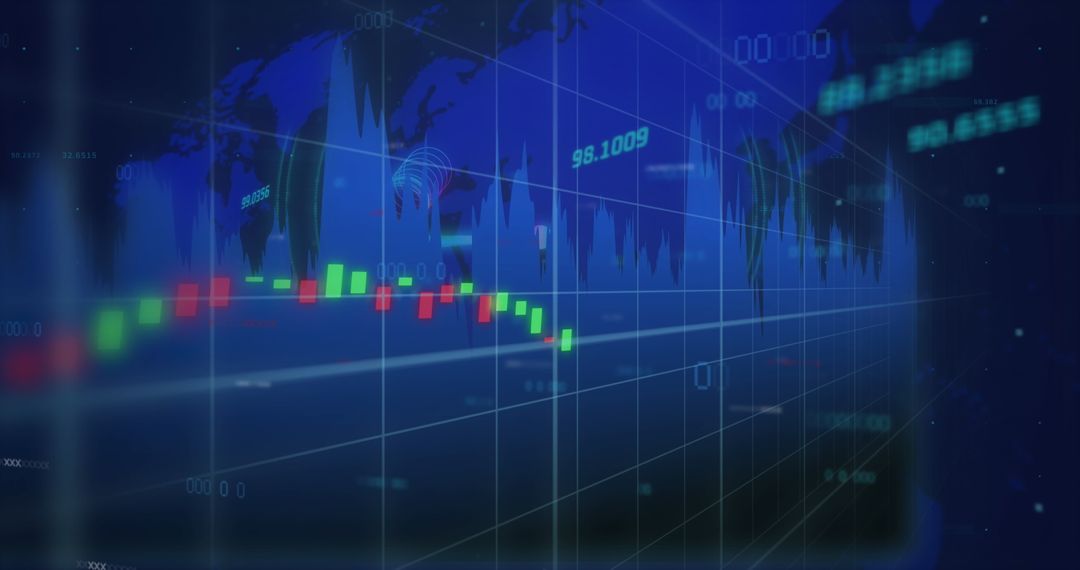
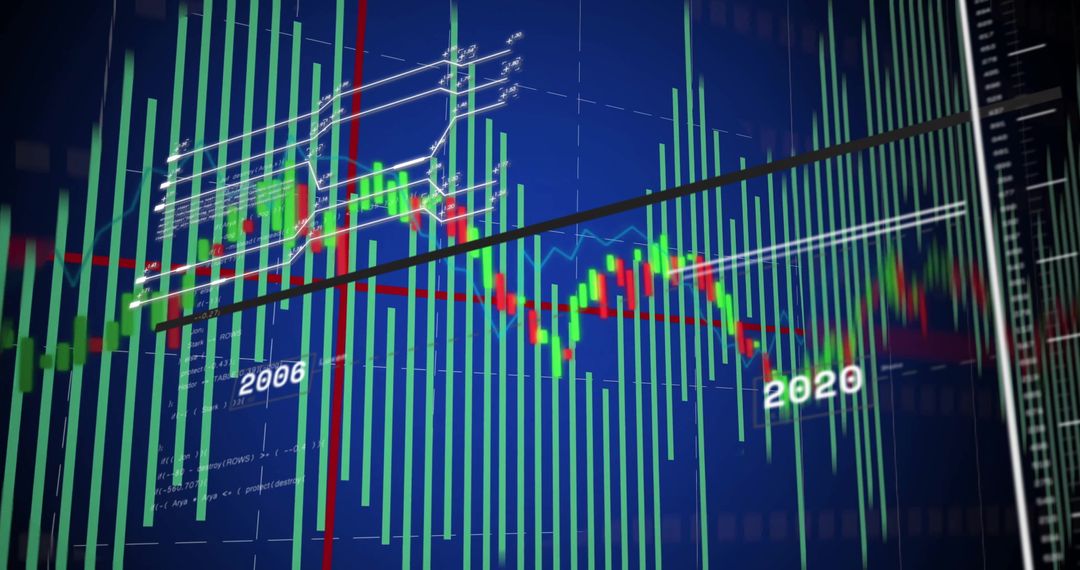
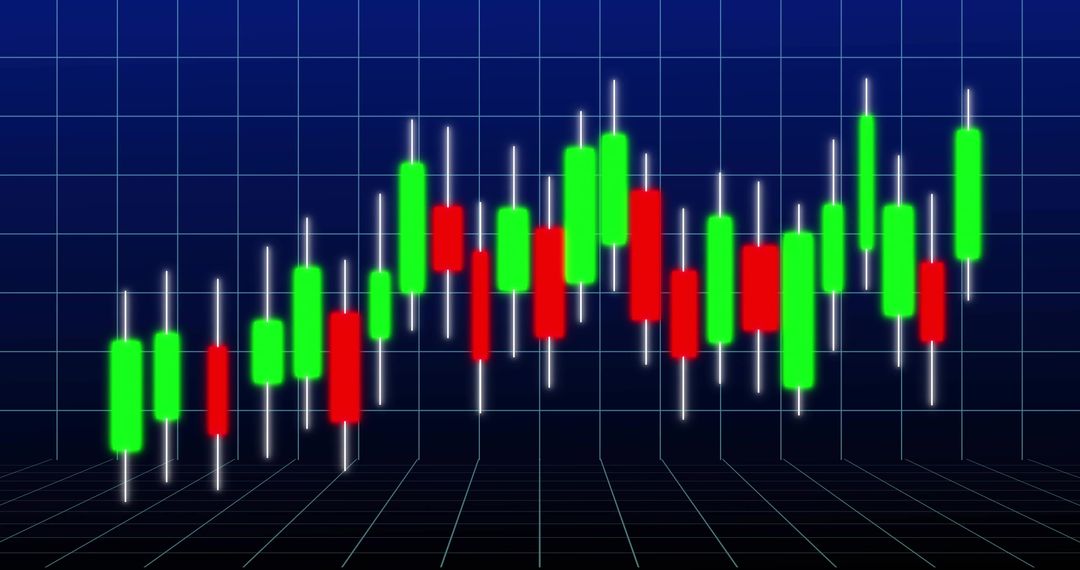
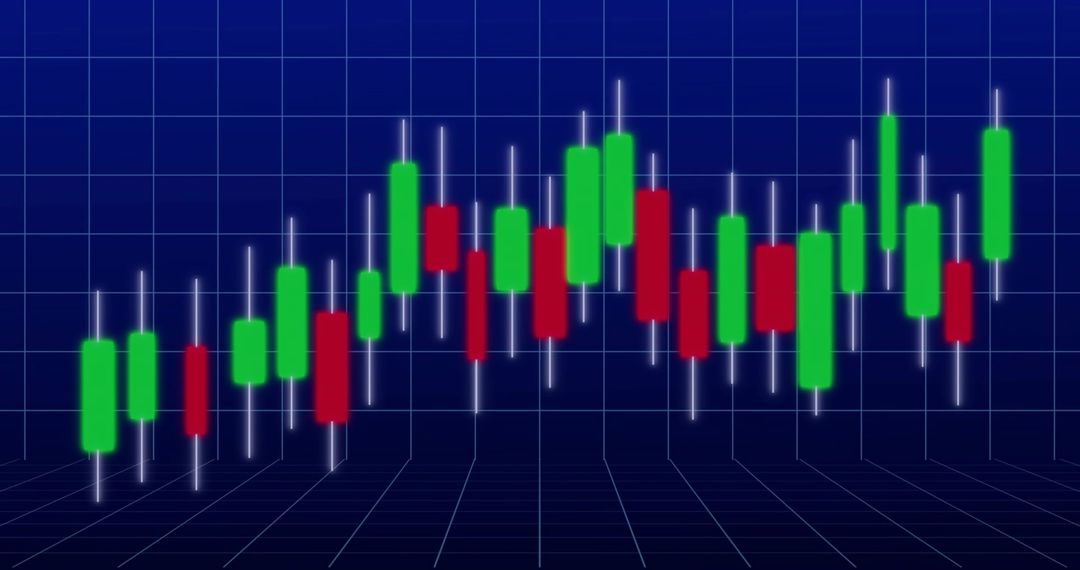
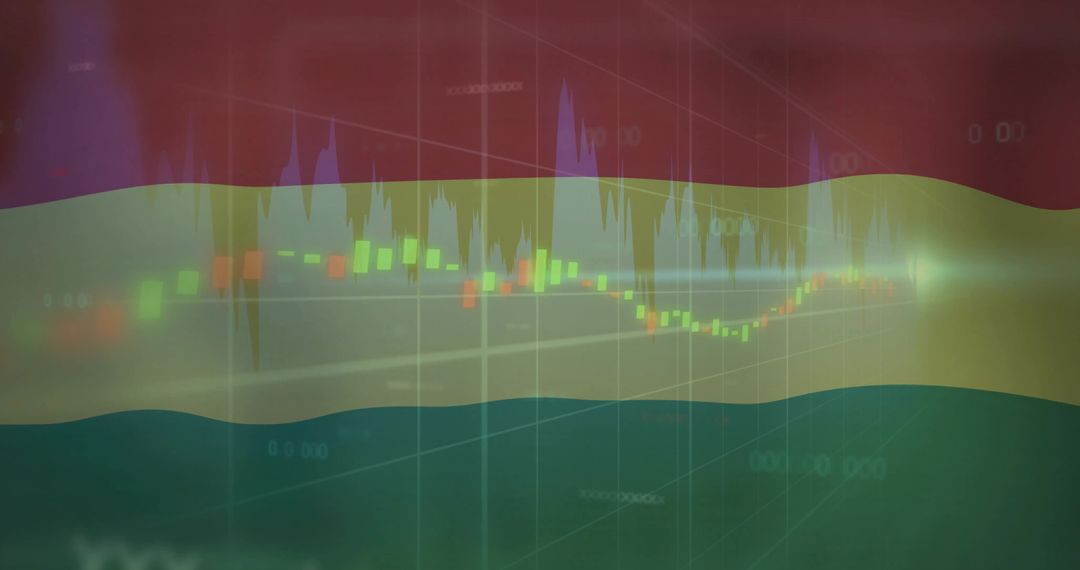
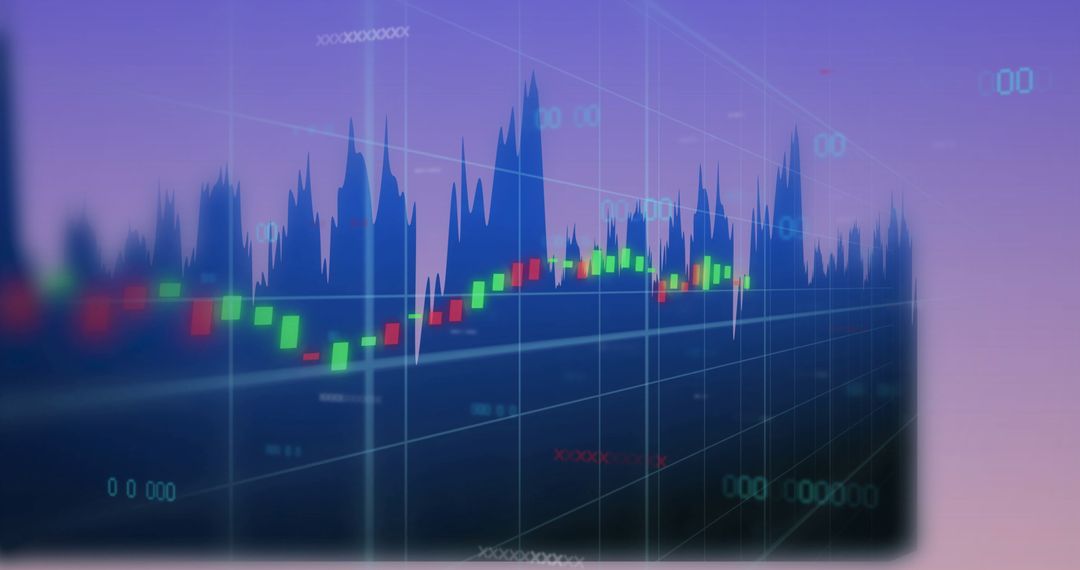
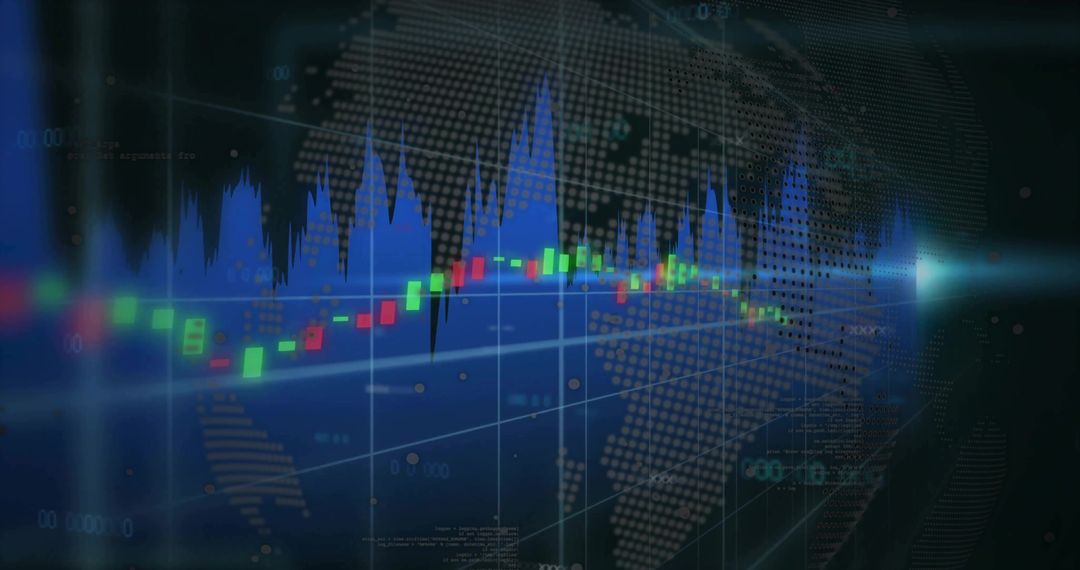
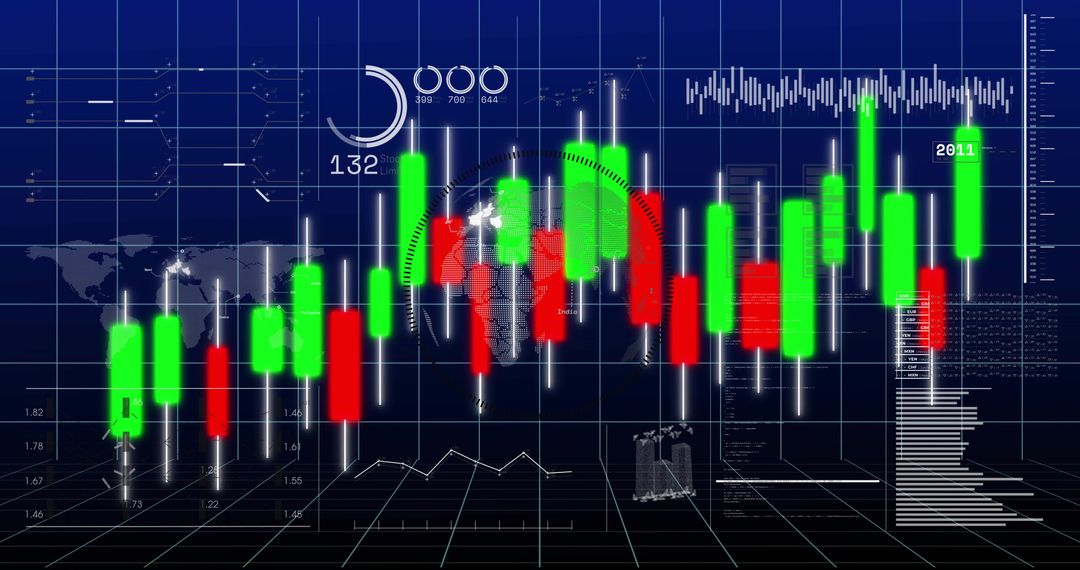
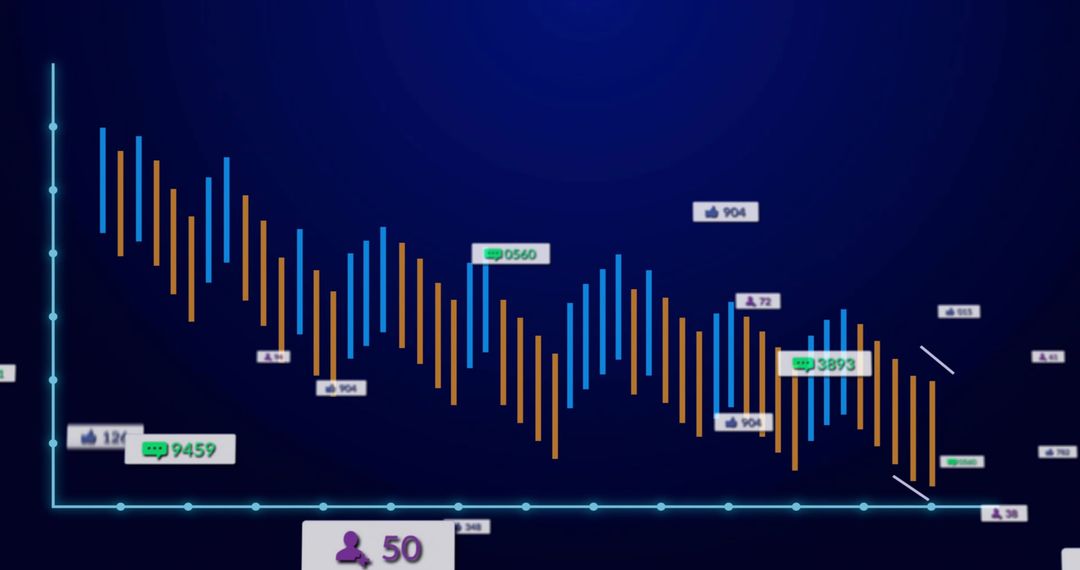
- Dynamic Financial Data with Glowing Candlestick Chart and Digital Numbers
Dynamic Financial Data with Glowing Candlestick Chart and Digital Numbers Image
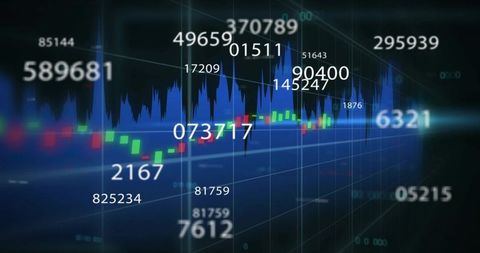
Visual representation emphasizes global economy, digital trading, or financial trends. Suitable for presentations on finance technology, investment strategies, or stock market analysis.
Powered by 


0
downloads
downloads
Tags:
More
Credit Photo
If you would like to credit the Photo, here are some ways you can do so
Text Link
photo Link
<span class="text-link">
<span>
<a target="_blank" href=https://pikwizard.com/photo/dynamic-financial-data-with-glowing-candlestick-chart-and-digital-numbers/d0abcbc746cad45df5b4b4b9648413a7/>PikWizard</a>
</span>
</span>
<span class="image-link">
<span
style="margin: 0 0 20px 0; display: inline-block; vertical-align: middle; width: 100%;"
>
<a
target="_blank"
href="https://pikwizard.com/photo/dynamic-financial-data-with-glowing-candlestick-chart-and-digital-numbers/d0abcbc746cad45df5b4b4b9648413a7/"
style="text-decoration: none; font-size: 10px; margin: 0;"
>
<img src="https://pikwizard.com/pw/medium/d0abcbc746cad45df5b4b4b9648413a7.jpg" style="margin: 0; width: 100%;" alt="" />
<p style="font-size: 12px; margin: 0;">PikWizard</p>
</a>
</span>
</span>
Free (free of charge)
Free for personal and commercial use.
Author: Creative Art
Similar Free Stock Images
Premium


Premium


Premium


Premium


Premium


Premium


Premium


Premium


Premium


Premium


Premium


Premium


Premium


Premium


Premium


Premium


Premium


Premium


Premium


Premium


Premium


Premium


Premium


Premium

