
- Home >
- Stock Photos >
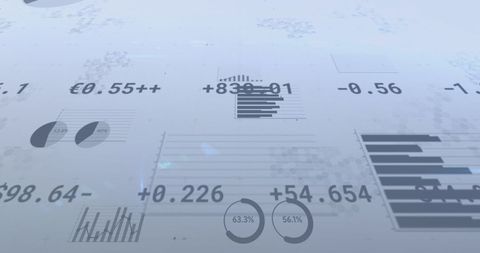
- Dynamic Financial Data with Graphs and Numbers Analytics
Dynamic Financial Data with Graphs and Numbers Analytics Image

Visual featuring dynamic financial data with various graphs and numbers. Ideal for content related to global business trends, economic analysis, or technology-driven finance solutions. Perfect for presentations, financial reports, or educational materials on market trends and economic forecasts.
Powered by 


downloads
Tags:
More
Credit Photo
If you would like to credit the Photo, here are some ways you can do so
Text Link
photo Link
<span class="text-link">
<span>
<a target="_blank" href=https://pikwizard.com/photo/dynamic-financial-data-with-graphs-and-numbers-analytics/4e6181c087aee8feecb82ffbe3826300/>PikWizard</a>
</span>
</span>
<span class="image-link">
<span
style="margin: 0 0 20px 0; display: inline-block; vertical-align: middle; width: 100%;"
>
<a
target="_blank"
href="https://pikwizard.com/photo/dynamic-financial-data-with-graphs-and-numbers-analytics/4e6181c087aee8feecb82ffbe3826300/"
style="text-decoration: none; font-size: 10px; margin: 0;"
>
<img src="https://pikwizard.com/pw/medium/4e6181c087aee8feecb82ffbe3826300.jpg" style="margin: 0; width: 100%;" alt="" />
<p style="font-size: 12px; margin: 0;">PikWizard</p>
</a>
</span>
</span>
Free (free of charge)
Free for personal and commercial use.
Author: Creative Art
Similar Free Stock Images

Premium


Premium


Premium

Premium


Premium


Premium

Premium


Premium


Premium


Premium


Premium


Premium


Premium


Premium

Premium


Premium


Premium


Premium

Premium


Premium

Premium


Premium


Premium


Premium


Premium


Explore More Free Stock Images