
- Home >
- Stock Photos >
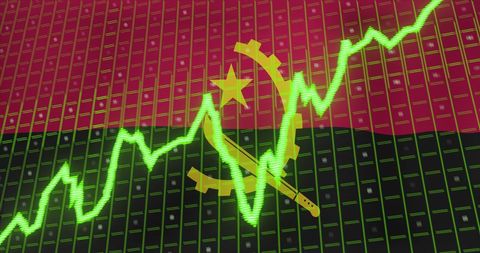
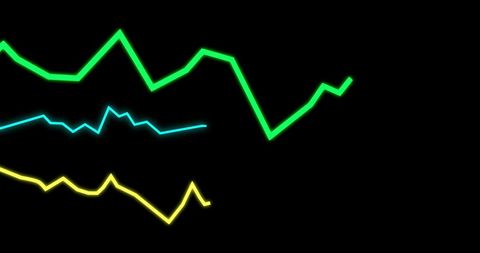
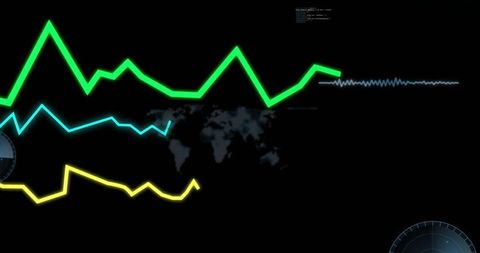
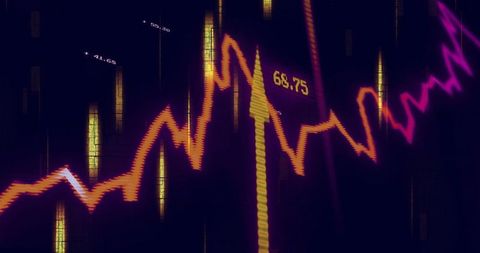
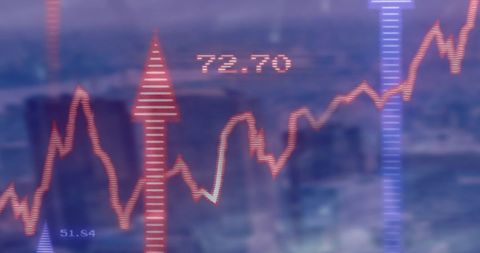
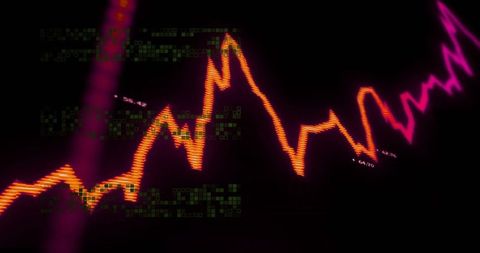
- Dynamic Financial Data with Vibrant Graph Arrows
Dynamic Financial Data with Vibrant Graph Arrows Image
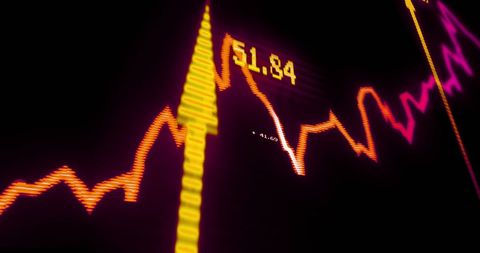
Pulsating graph arrows and numerical data represent financial trends. Ideal for illustrating concepts related to stock market dynamics, economic forecasts, or financial reports in presentations or digital marketing.
Powered by 


downloads
Tags:
More
Credit Photo
If you would like to credit the Photo, here are some ways you can do so
Text Link
photo Link
<span class="text-link">
<span>
<a target="_blank" href=https://pikwizard.com/photo/dynamic-financial-data-with-vibrant-graph-arrows/4147a38cea4e4aea1ad89203c5acc34f/>PikWizard</a>
</span>
</span>
<span class="image-link">
<span
style="margin: 0 0 20px 0; display: inline-block; vertical-align: middle; width: 100%;"
>
<a
target="_blank"
href="https://pikwizard.com/photo/dynamic-financial-data-with-vibrant-graph-arrows/4147a38cea4e4aea1ad89203c5acc34f/"
style="text-decoration: none; font-size: 10px; margin: 0;"
>
<img src="https://pikwizard.com/pw/medium/4147a38cea4e4aea1ad89203c5acc34f.jpg" style="margin: 0; width: 100%;" alt="" />
<p style="font-size: 12px; margin: 0;">PikWizard</p>
</a>
</span>
</span>
Free (free of charge)
Free for personal and commercial use.
Author: Authentic Images
Similar Free Stock Images

Premium


Premium

Premium


Premium


Premium


Premium


Premium

Premium

Premium


Premium

Premium


Premium


Premium

Premium


Premium


Premium


Premium


Premium


Premium


Premium


Premium

Premium


Premium


Premium


Premium

Explore More Free Stock Images