
- Home >
- Stock Photos >
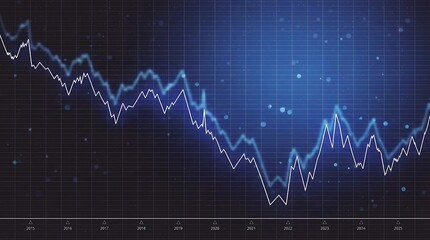
- Dynamic Financial Fluctuation on Digital Graph
Dynamic Financial Fluctuation on Digital Graph Image

Captures dynamic movement in financial markets with vivid colors representing stock fluctuations against a dramatic navy grid background. Ideal for illustrating economic trends, financial analysis reports, technology-related blog posts, or presentations focused on market insights.
Powered by 


downloads
Tags:
More
Credit Photo
If you would like to credit the Photo, here are some ways you can do so
Text Link
photo Link
<span class="text-link">
<span>
<a target="_blank" href=https://pikwizard.com/photo/dynamic-financial-fluctuation-on-digital-graph/e9c865e63dbe773dfd74695c8912eb25/>PikWizard</a>
</span>
</span>
<span class="image-link">
<span
style="margin: 0 0 20px 0; display: inline-block; vertical-align: middle; width: 100%;"
>
<a
target="_blank"
href="https://pikwizard.com/photo/dynamic-financial-fluctuation-on-digital-graph/e9c865e63dbe773dfd74695c8912eb25/"
style="text-decoration: none; font-size: 10px; margin: 0;"
>
<img src="https://pikwizard.com/pw/medium/e9c865e63dbe773dfd74695c8912eb25.jpg" style="margin: 0; width: 100%;" alt="" />
<p style="font-size: 12px; margin: 0;">PikWizard</p>
</a>
</span>
</span>
Free (free of charge)
Free for personal and commercial use.
Author: People Creations
Similar Free Stock Images

Premium


Premium


Premium


Premium


Premium


Premium


Premium


Premium

Premium


Premium


Premium

Premium


Premium


Premium

Premium


Premium


Premium


Premium


Premium


Premium


Premium


Premium

Premium


Premium


Premium

Explore More Free Stock Images