
- Home >
- Stock Photos >
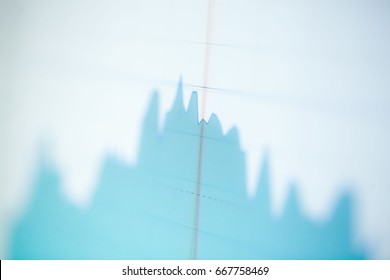
- Dynamic Financial Graph Analyzing Market Trends
Dynamic Financial Graph Analyzing Market Trends Image

Colorful financial graphs focus on expert stock analysis and data processing, useful for finance-related presentations, reports, or educational materials in the trade and economics fields. Captures the fluctuation of market values for study of current financial climates.
Powered by  - Get 15% off with code: PIKWIZARD15


downloads
Tags:
More
Credit Photo
If you would like to credit the Photo, here are some ways you can do so
Text Link
photo Link
<span class="text-link">
<span>
<a target="_blank" href=https://pikwizard.com/photo/dynamic-financial-graph-analyzing-market-trends/d209ce18fb68fc32d8e3d1ede8eaf12e/>PikWizard</a>
</span>
</span>
<span class="image-link">
<span
style="margin: 0 0 20px 0; display: inline-block; vertical-align: middle; width: 100%;"
>
<a
target="_blank"
href="https://pikwizard.com/photo/dynamic-financial-graph-analyzing-market-trends/d209ce18fb68fc32d8e3d1ede8eaf12e/"
style="text-decoration: none; font-size: 10px; margin: 0;"
>
<img src="https://pikwizard.com/pw/medium/d209ce18fb68fc32d8e3d1ede8eaf12e.jpg" style="margin: 0; width: 100%;" alt="" />
<p style="font-size: 12px; margin: 0;">PikWizard</p>
</a>
</span>
</span>
Free (free of charge)
Free for personal and commercial use.
Author: Creative Art
Similar Free Stock Images

Premium


Premium


Premium


Premium


Premium

Premium

Premium

Premium


Premium


Premium

Premium

Premium

Premium


Premium

Premium


Premium


Premium


Premium


Premium


Premium

Premium

Premium


Premium


Premium


Premium


Explore More Free Stock Images