
- Home >
- Stock Photos >
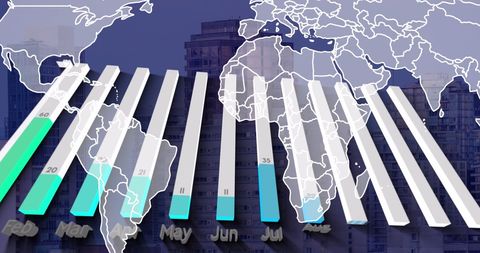
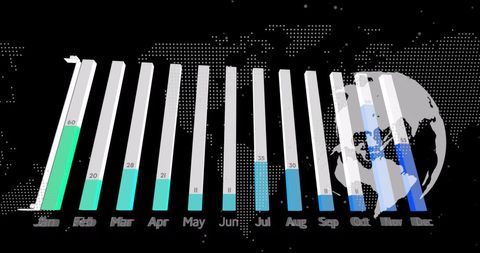
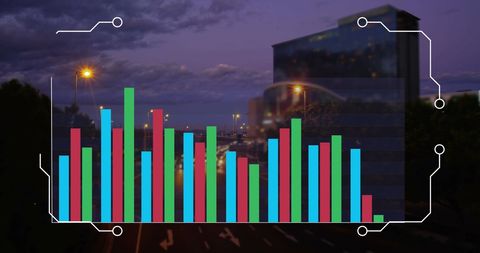
- Dynamic Financial Graph and Data Visualization in Digital Space
Dynamic Financial Graph and Data Visualization in Digital Space Image

This dynamic representation of a financial graph showcases economic trends with a dark, digital interface, providing a futuristic and analytical feel. Useful for illustrating financial reports, investment presentations, or economic studies, this imagery suggests innovation and high-tech analysis frameworks within the finance industry.
Powered by 


downloads
Tags:
More
Credit Photo
If you would like to credit the Photo, here are some ways you can do so
Text Link
photo Link
<span class="text-link">
<span>
<a target="_blank" href=https://pikwizard.com/photo/dynamic-financial-graph-and-data-visualization-in-digital-space/234ec5b6ce7f1be62b96a14c745136aa/>PikWizard</a>
</span>
</span>
<span class="image-link">
<span
style="margin: 0 0 20px 0; display: inline-block; vertical-align: middle; width: 100%;"
>
<a
target="_blank"
href="https://pikwizard.com/photo/dynamic-financial-graph-and-data-visualization-in-digital-space/234ec5b6ce7f1be62b96a14c745136aa/"
style="text-decoration: none; font-size: 10px; margin: 0;"
>
<img src="https://pikwizard.com/pw/medium/234ec5b6ce7f1be62b96a14c745136aa.jpg" style="margin: 0; width: 100%;" alt="" />
<p style="font-size: 12px; margin: 0;">PikWizard</p>
</a>
</span>
</span>
Free (free of charge)
Free for personal and commercial use.
Author: People Creations
Similar Free Stock Images

Premium


Premium


Premium


Premium


Premium


Premium


Premium


Premium


Premium


Premium


Premium


Premium


Premium


Premium

Premium


Premium


Premium


Premium


Premium


Premium


Premium

Premium


Premium


Premium


Premium


Explore More Free Stock Images