
- Home >
- Stock Photos >
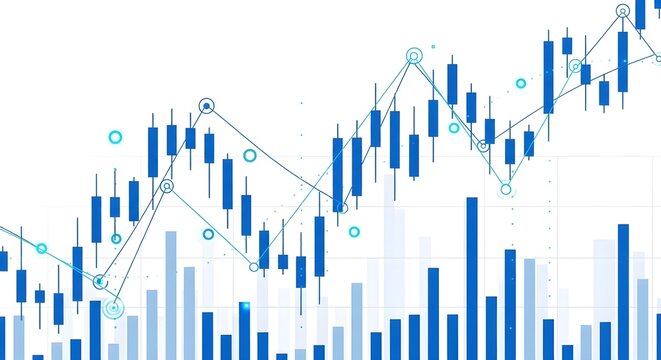
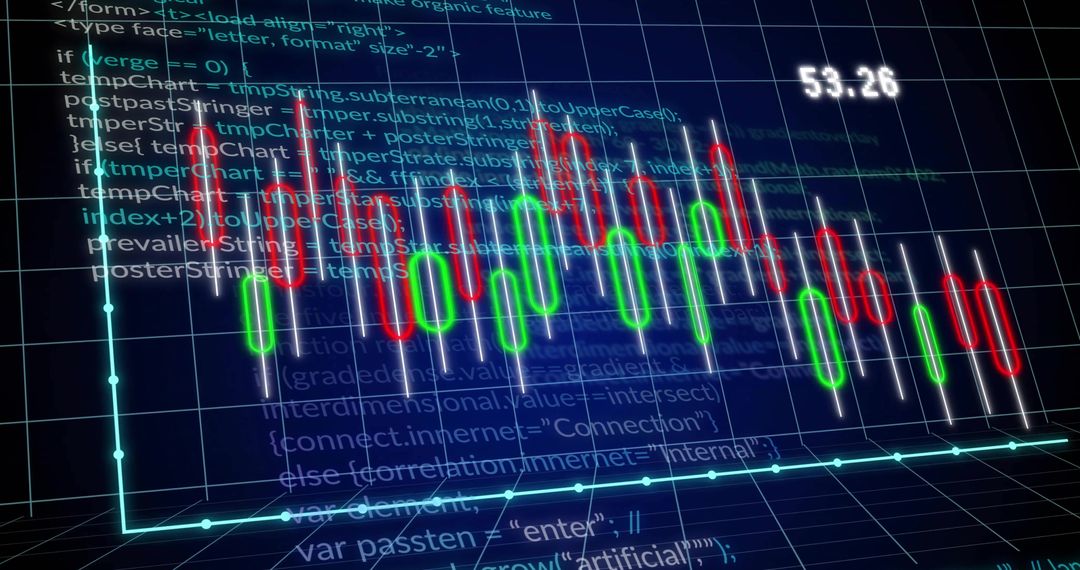
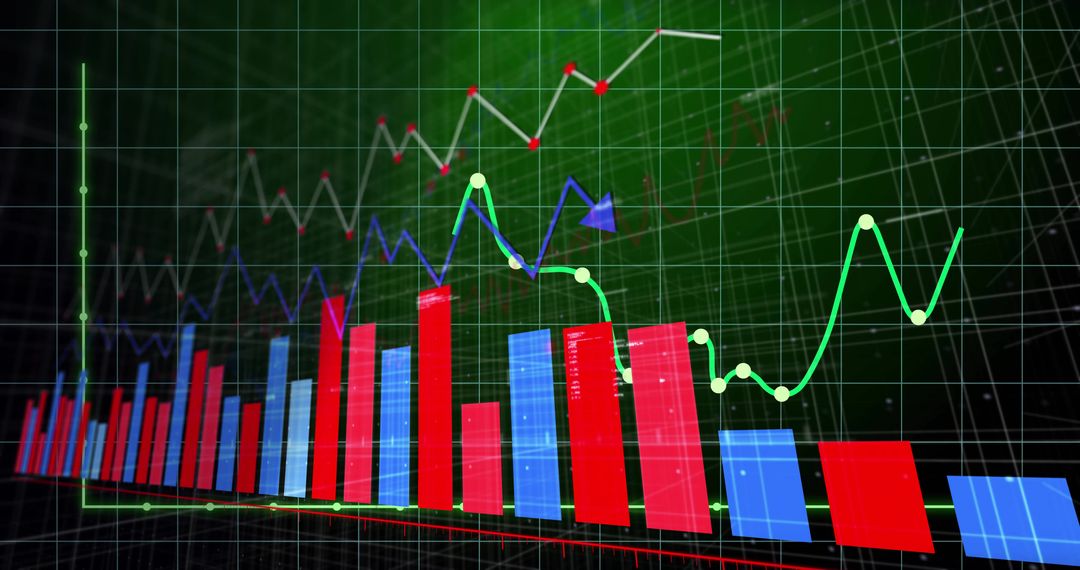
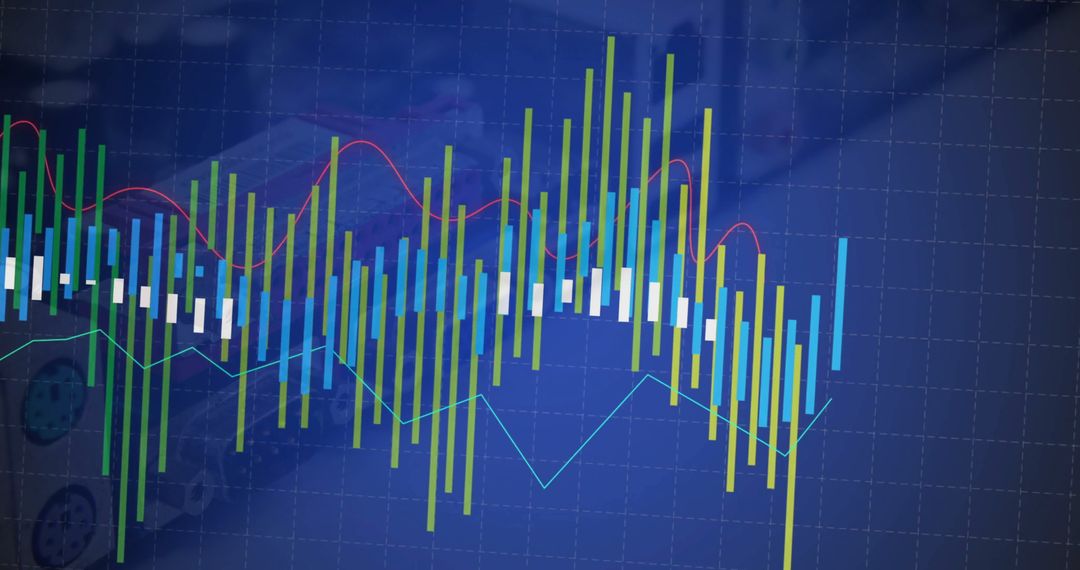
- Dynamic Financial Graph Displaying Market Trends with Bar and Line Charts
Dynamic Financial Graph Displaying Market Trends with Bar and Line Charts Image

This abstract visualization showcases a financial graph with distinctive bar and line charts reflecting market trends on a digital platform. Perfect for illustrating concepts in finance, analytics, data modeling, and technology, it is ideal for educational, seminar, and conference presentations or digital content focused on financial markets and data science.
Powered by 


0
downloads
downloads
Tags:
More
Credit Photo
If you would like to credit the Photo, here are some ways you can do so
Text Link
photo Link
<span class="text-link">
<span>
<a target="_blank" href=https://pikwizard.com/photo/dynamic-financial-graph-displaying-market-trends-with-bar-and-line-charts/8a4bf19fed55ae7210b12a800574ad70/>PikWizard</a>
</span>
</span>
<span class="image-link">
<span
style="margin: 0 0 20px 0; display: inline-block; vertical-align: middle; width: 100%;"
>
<a
target="_blank"
href="https://pikwizard.com/photo/dynamic-financial-graph-displaying-market-trends-with-bar-and-line-charts/8a4bf19fed55ae7210b12a800574ad70/"
style="text-decoration: none; font-size: 10px; margin: 0;"
>
<img src="https://pikwizard.com/pw/medium/8a4bf19fed55ae7210b12a800574ad70.jpg" style="margin: 0; width: 100%;" alt="" />
<p style="font-size: 12px; margin: 0;">PikWizard</p>
</a>
</span>
</span>
Free (free of charge)
Free for personal and commercial use.
Author: Creative Art
Similar Free Stock Images

Premium


Premium


Premium


Premium


Premium


Premium


Premium


Premium


Premium


Premium


Premium


Premium


Premium


Premium


Premium


Premium


Premium


Premium


Premium


Premium


Premium


Premium


Premium


Premium

