
- Home >
- Stock Photos >
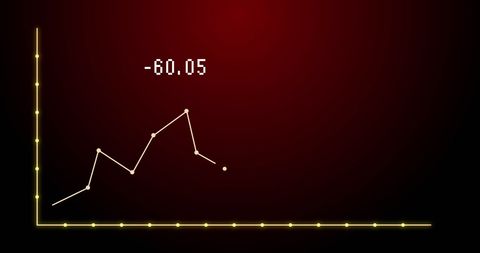
- Dynamic Financial Graph on Dark Red Background
Dynamic Financial Graph on Dark Red Background Image
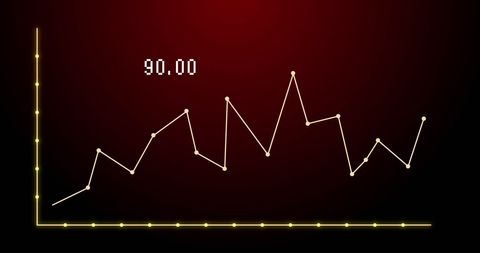
This digital visualization depicts a line graph set against a dramatic dark red backdrop, indicating financial data analysis. Suitable for presentations related to finance, economic trends, market analysis, and statistics. Ideal for use in reports, slides, or marketing materials discussing economic and financial subjects.
Powered by  - Get 15% off with code: PIKWIZARD15


downloads
Tags:
More
Credit Photo
If you would like to credit the Photo, here are some ways you can do so
Text Link
photo Link
<span class="text-link">
<span>
<a target="_blank" href=https://pikwizard.com/photo/dynamic-financial-graph-on-dark-red-background/7691bc4d859bb37df43ae95be4fca5f5/>PikWizard</a>
</span>
</span>
<span class="image-link">
<span
style="margin: 0 0 20px 0; display: inline-block; vertical-align: middle; width: 100%;"
>
<a
target="_blank"
href="https://pikwizard.com/photo/dynamic-financial-graph-on-dark-red-background/7691bc4d859bb37df43ae95be4fca5f5/"
style="text-decoration: none; font-size: 10px; margin: 0;"
>
<img src="https://pikwizard.com/pw/medium/7691bc4d859bb37df43ae95be4fca5f5.jpg" style="margin: 0; width: 100%;" alt="" />
<p style="font-size: 12px; margin: 0;">PikWizard</p>
</a>
</span>
</span>
Free (free of charge)
Free for personal and commercial use.
Author: Awesome Content
Similar Free Stock Images

Premium


Premium

Premium


Premium


Premium


Premium

Premium


Premium


Premium


Premium

Premium


Premium


Premium


Premium


Premium


Premium


Premium


Premium


Premium


Premium


Premium

Premium


Premium


Premium


Premium


Explore More Free Stock Images