- Home >
- Stock Photos >
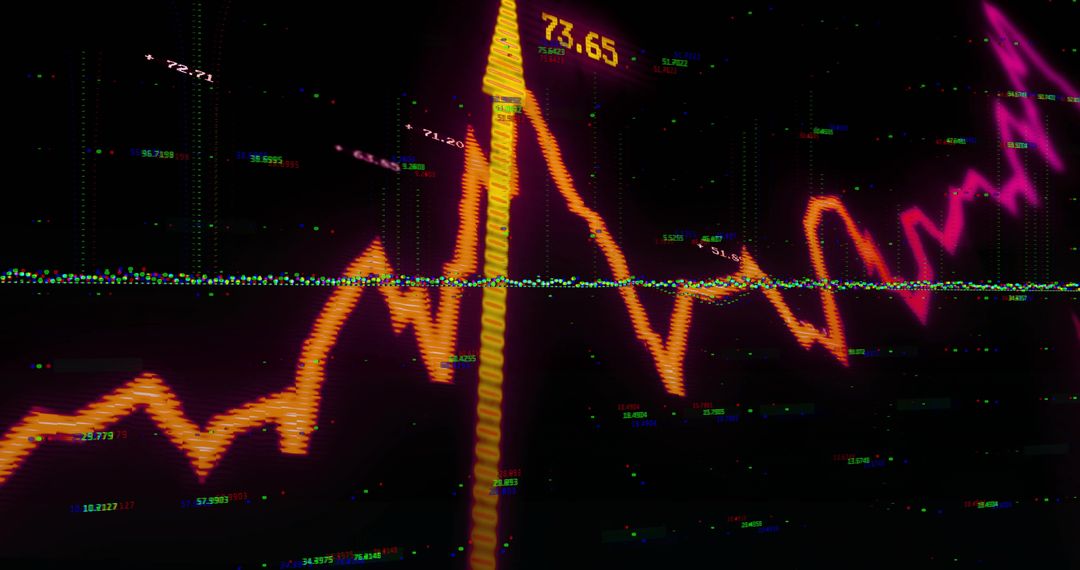
- Dynamic Financial Graph on Luminous Green Background
Dynamic Financial Graph on Luminous Green Background Image

Graph features undulating line denoting financial trends over dark green background with grid pattern. Useful for presentations on economic trends, business reports, statistics analysis, and finance software interfaces. Ideal for illustrating topics in economics, data science, or financial market updates with visual impact.
Powered by  - Get 15% off with code: PIKWIZARD15


2
downloads
downloads
Tags:
More
Credit Photo
If you would like to credit the Photo, here are some ways you can do so
Text Link
photo Link
<span class="text-link">
<span>
<a target="_blank" href=https://pikwizard.com/photo/dynamic-financial-graph-on-luminous-green-background/bf87840844788e36aa5dbc0d6031c1ba/>PikWizard</a>
</span>
</span>
<span class="image-link">
<span
style="margin: 0 0 20px 0; display: inline-block; vertical-align: middle; width: 100%;"
>
<a
target="_blank"
href="https://pikwizard.com/photo/dynamic-financial-graph-on-luminous-green-background/bf87840844788e36aa5dbc0d6031c1ba/"
style="text-decoration: none; font-size: 10px; margin: 0;"
>
<img src="https://pikwizard.com/pw/medium/bf87840844788e36aa5dbc0d6031c1ba.jpg" style="margin: 0; width: 100%;" alt="" />
<p style="font-size: 12px; margin: 0;">PikWizard</p>
</a>
</span>
</span>
Free (free of charge)
Free for personal and commercial use.
Author: Awesome Content
Similar Free Stock Images

Premium


Premium


Premium


Premium


Premium


Premium


Premium


Premium


Premium


Premium


Premium


Premium


Premium


Premium


Premium


Premium


Premium


Premium


Premium


Premium


Premium


Premium


Premium


Premium