
- Home >
- Stock Photos >
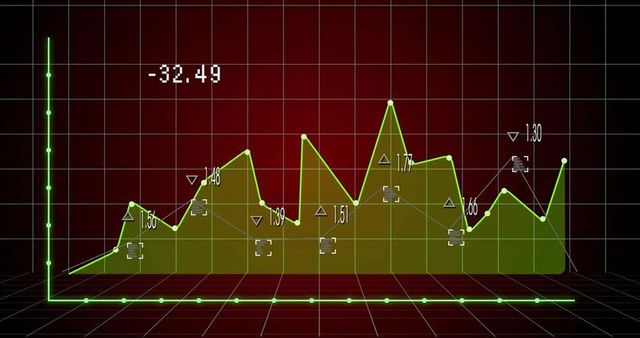
- Dynamic Financial Graph Over Red Background
Dynamic Financial Graph Over Red Background Image

This image illustrates a financial graph displayed over a dark red background, highlighting trends and shifts in data. Suitable for use in financial reports, presentations about market analysis, or educational materials explaining economic concepts. Perfect for websites, articles, or marketing materials focused on finance, data analysis, or investment strategies.
Powered by 


downloads
Tags:
More
Credit Photo
If you would like to credit the Photo, here are some ways you can do so
Text Link
photo Link
<span class="text-link">
<span>
<a target="_blank" href=https://pikwizard.com/photo/dynamic-financial-graph-over-red-background/45f8b1919d424ee3b93613a1c5dbd1f9/>PikWizard</a>
</span>
</span>
<span class="image-link">
<span
style="margin: 0 0 20px 0; display: inline-block; vertical-align: middle; width: 100%;"
>
<a
target="_blank"
href="https://pikwizard.com/photo/dynamic-financial-graph-over-red-background/45f8b1919d424ee3b93613a1c5dbd1f9/"
style="text-decoration: none; font-size: 10px; margin: 0;"
>
<img src="https://pikwizard.com/pw/medium/45f8b1919d424ee3b93613a1c5dbd1f9.jpg" style="margin: 0; width: 100%;" alt="" />
<p style="font-size: 12px; margin: 0;">PikWizard</p>
</a>
</span>
</span>
Free (free of charge)
Free for personal and commercial use.
Author: Authentic Images
Similar Free Stock Images

Premium


Premium

Premium


Premium

Premium

Premium


Premium


Premium


Premium


Premium


Premium


Premium

Premium


Premium


Premium


Premium


Premium


Premium


Premium


Premium

Premium


Premium

Premium


Premium


Premium


Explore More Free Stock Images