- Home >
- Stock Photos >
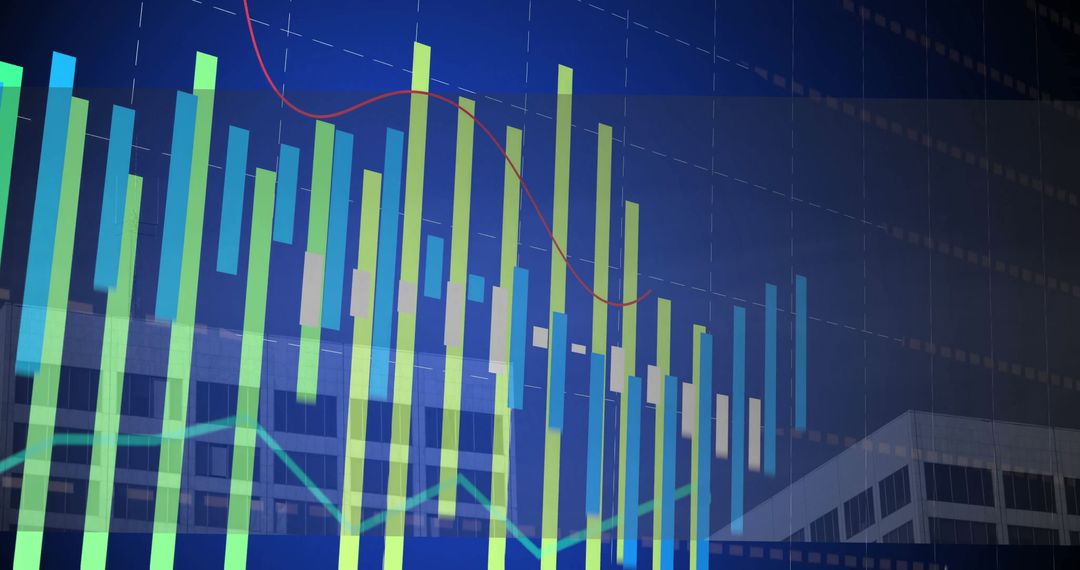
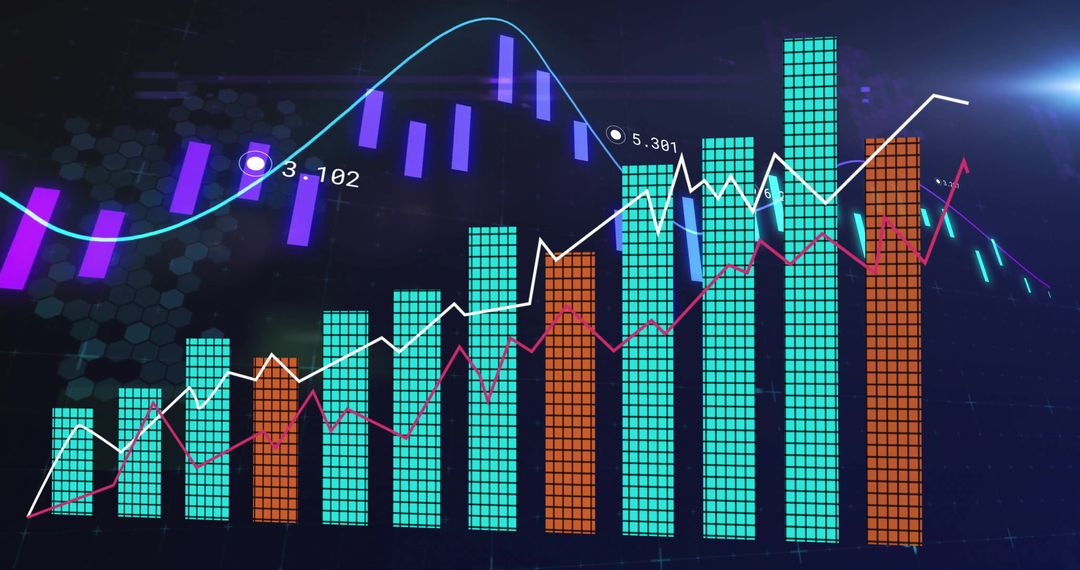
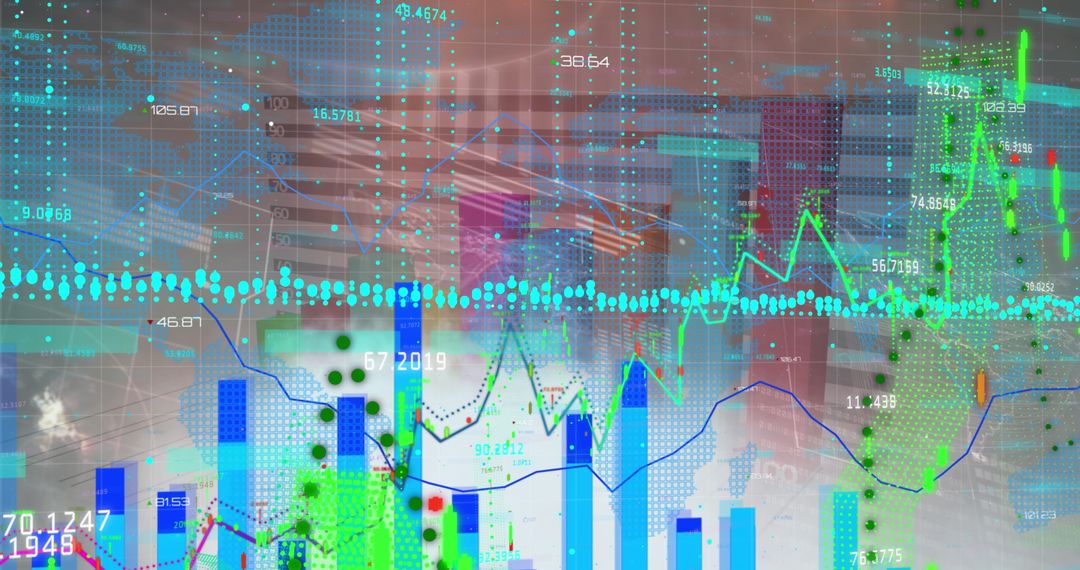
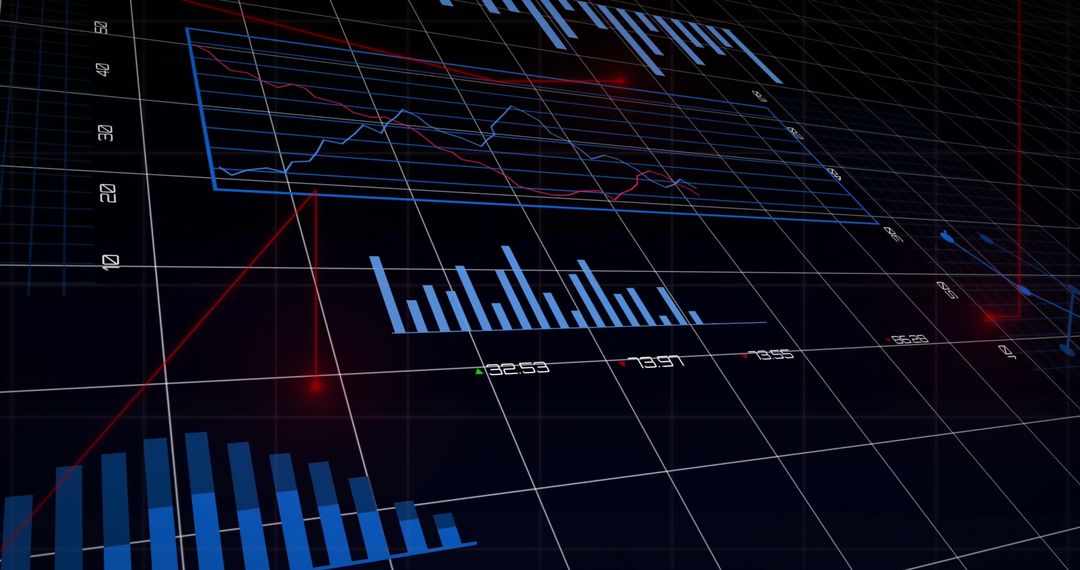
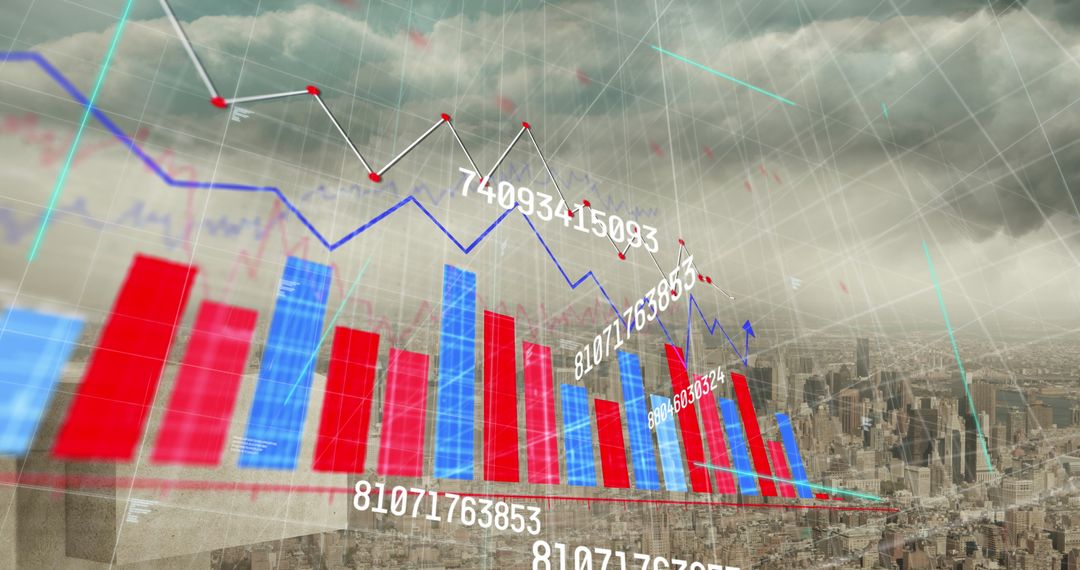
- Dynamic Financial Graph with Data Analytics Overlaid on Dark Background
Dynamic Financial Graph with Data Analytics Overlaid on Dark Background Image

Digits and charts illustrate volatile financial markets, making it ideal for financial newsletters, business presentations, articles on economic analysis, and marketing materials.
Powered by 


2
downloads
downloads
Tags:
More
Credit Photo
If you would like to credit the Photo, here are some ways you can do so
Text Link
photo Link
<span class="text-link">
<span>
<a target="_blank" href=https://pikwizard.com/photo/dynamic-financial-graph-with-data-analytics-overlaid-on-dark-background/12575a04865a2085fc554661e539391b/>PikWizard</a>
</span>
</span>
<span class="image-link">
<span
style="margin: 0 0 20px 0; display: inline-block; vertical-align: middle; width: 100%;"
>
<a
target="_blank"
href="https://pikwizard.com/photo/dynamic-financial-graph-with-data-analytics-overlaid-on-dark-background/12575a04865a2085fc554661e539391b/"
style="text-decoration: none; font-size: 10px; margin: 0;"
>
<img src="https://pikwizard.com/pw/medium/12575a04865a2085fc554661e539391b.jpg" style="margin: 0; width: 100%;" alt="" />
<p style="font-size: 12px; margin: 0;">PikWizard</p>
</a>
</span>
</span>
Free (free of charge)
Free for personal and commercial use.
Author: Awesome Content
Similar Free Stock Images

Premium


Premium


Premium


Premium


Premium


Premium


Premium


Premium


Premium


Premium


Premium


Premium


Premium


Premium


Premium


Premium


Premium


Premium


Premium


Premium


Premium


Premium


Premium


Premium