- Home >
- Stock Photos >
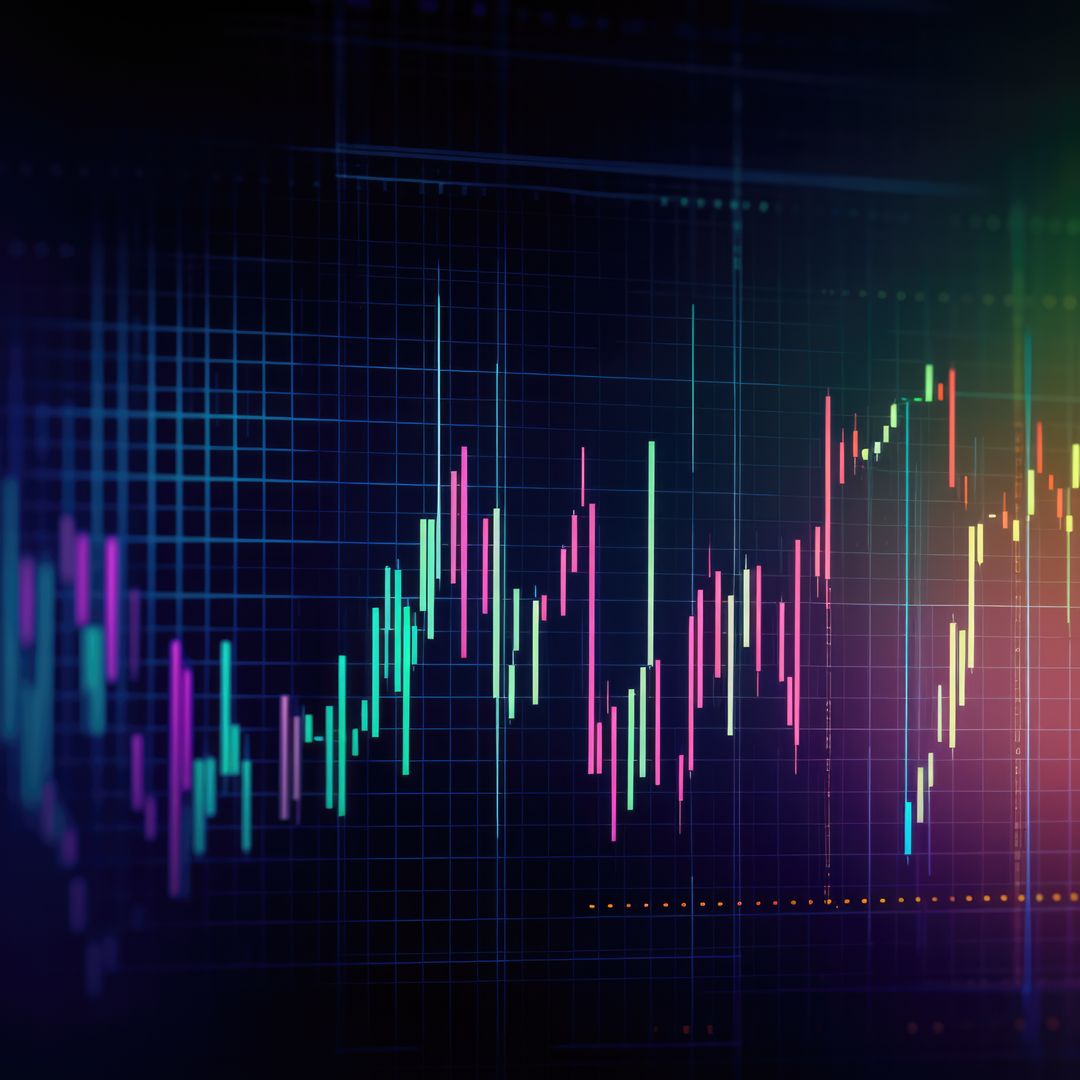
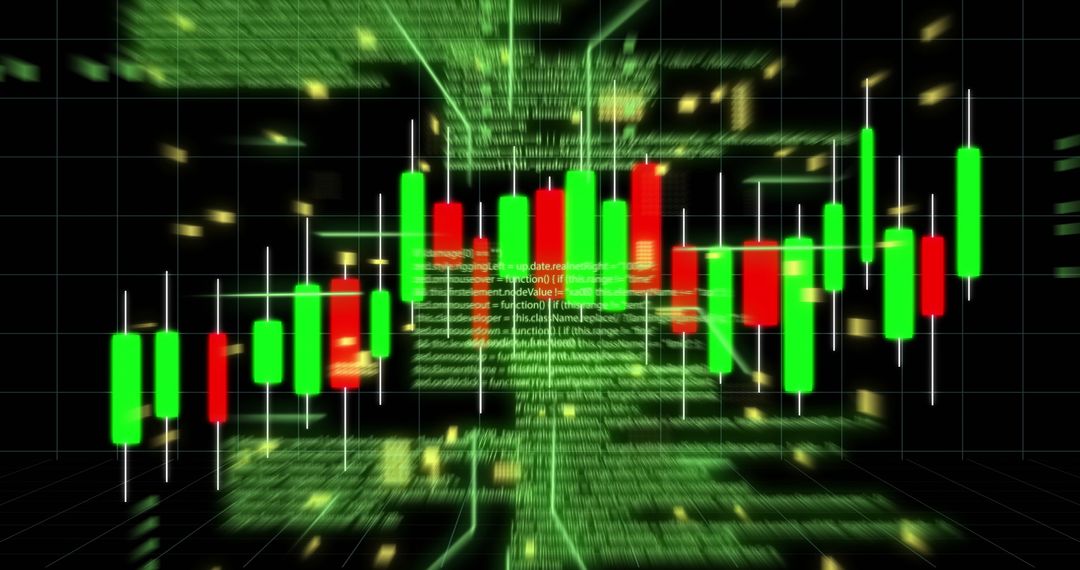
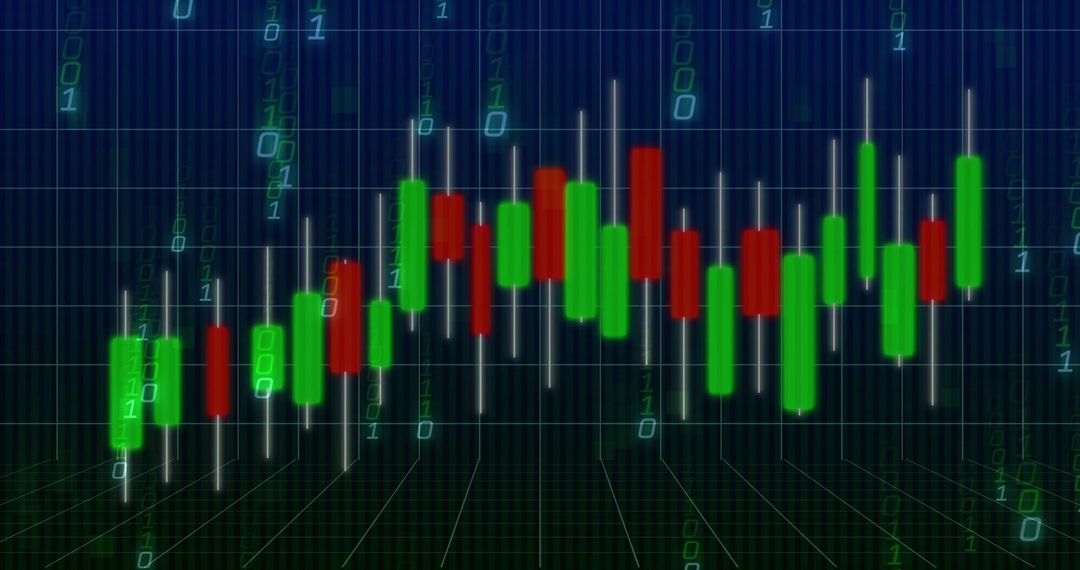
- Dynamic Financial Graph with Green and Red Candles
Dynamic Financial Graph with Green and Red Candles Image

Financial graph showcasing green and red candlestick patterns over a grid background. Useful for representing stock market trends, economic forecasts, or trading strategies. Ideal for financial reports, educational materials, or investment platforms. Provides an engaging visualization of fluctuating financial data.
Powered by  - Get 15% off with code: PIKWIZARD15


2
downloads
downloads
Tags:
More
Credit Photo
If you would like to credit the Photo, here are some ways you can do so
Text Link
photo Link
<span class="text-link">
<span>
<a target="_blank" href=https://pikwizard.com/photo/dynamic-financial-graph-with-green-and-red-candles/75cb0ff7f72d8b70f9ba54e67cbf33d1/>PikWizard</a>
</span>
</span>
<span class="image-link">
<span
style="margin: 0 0 20px 0; display: inline-block; vertical-align: middle; width: 100%;"
>
<a
target="_blank"
href="https://pikwizard.com/photo/dynamic-financial-graph-with-green-and-red-candles/75cb0ff7f72d8b70f9ba54e67cbf33d1/"
style="text-decoration: none; font-size: 10px; margin: 0;"
>
<img src="https://pikwizard.com/pw/medium/75cb0ff7f72d8b70f9ba54e67cbf33d1.jpg" style="margin: 0; width: 100%;" alt="" />
<p style="font-size: 12px; margin: 0;">PikWizard</p>
</a>
</span>
</span>
Free (free of charge)
Free for personal and commercial use.
Author: Creative Art
Similar Free Stock Images

Premium


Premium


Premium


Premium


Premium


Premium


Premium


Premium


Premium


Premium


Premium


Premium


Premium


Premium


Premium


Premium


Premium


Premium


Premium


Premium


Premium


Premium


Premium


Premium