
- Home >
- Stock Photos >
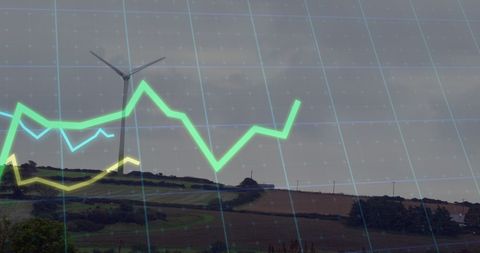
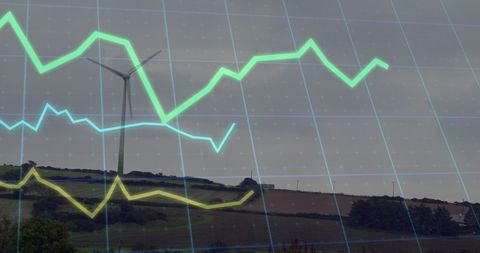
- Dynamic Financial Graph with Transparency Effect Overlay
Dynamic Financial Graph with Transparency Effect Overlay Image

Financial graphs with colorful lines represent fluctuating trends in stocks or markets. Ideal for business presentations, websites focused on finance, articles on economic forecasting, or educational materials about reading and analyzing data trends.
Powered by 


downloads
Tags:
More
Credit Photo
If you would like to credit the Photo, here are some ways you can do so
Text Link
photo Link
<span class="text-link">
<span>
<a target="_blank" href=https://pikwizard.com/photo/dynamic-financial-graph-with-transparency-effect-overlay/2c4ef7c8e60c3873363d9fc7f6d8e631/>PikWizard</a>
</span>
</span>
<span class="image-link">
<span
style="margin: 0 0 20px 0; display: inline-block; vertical-align: middle; width: 100%;"
>
<a
target="_blank"
href="https://pikwizard.com/photo/dynamic-financial-graph-with-transparency-effect-overlay/2c4ef7c8e60c3873363d9fc7f6d8e631/"
style="text-decoration: none; font-size: 10px; margin: 0;"
>
<img src="https://pikwizard.com/pw/medium/2c4ef7c8e60c3873363d9fc7f6d8e631.jpg" style="margin: 0; width: 100%;" alt="" />
<p style="font-size: 12px; margin: 0;">PikWizard</p>
</a>
</span>
</span>
Free (free of charge)
Free for personal and commercial use.
Author: Awesome Content
Similar Free Stock Images

Premium


Premium

Premium

Premium


Premium


Premium

Premium


Premium

Premium

Premium

Premium


Premium

Premium


Premium


Premium
Premium

Premium


Premium


Premium


Premium


Premium


Premium


Premium


Premium


Premium

Explore More Free Stock Images