
- Home >
- Stock Photos >
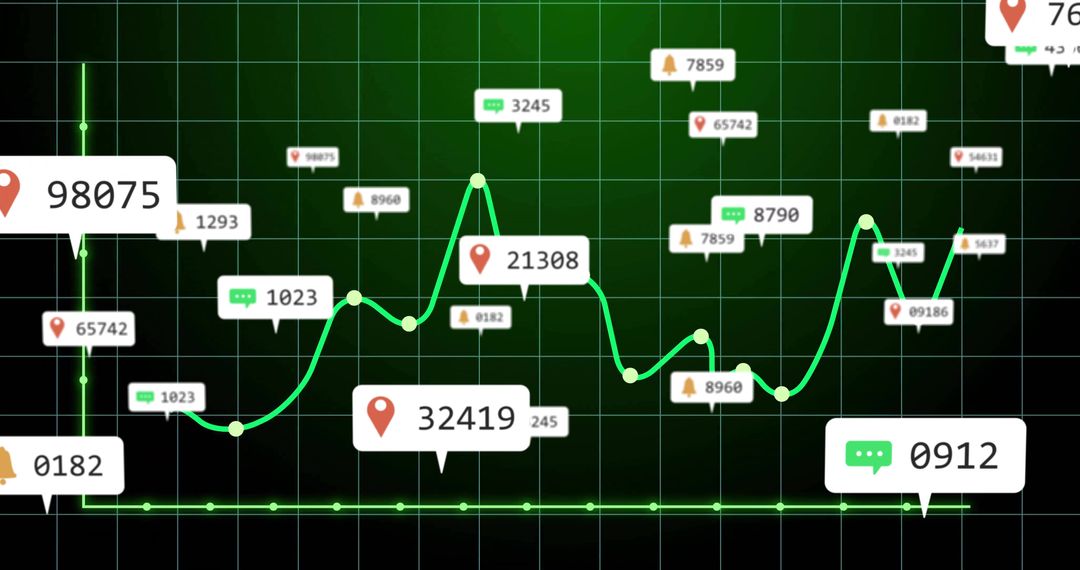
- Dynamic Financial Graph with Violet Background Concept
Dynamic Financial Graph with Violet Background Concept Image

Illustrates the dynamic nature of financial markets with a striking violet background. Useful for presentations related to finance, economy, or technology sectors. Perfect for reports on business growth, investing strategies, market trends, or statistical analysis. The digital chart highlights data fluctuations and analysis insights.
Powered by  - Get 15% off with code: PIKWIZARD15


2
downloads
downloads
Tags:
More
Credit Photo
If you would like to credit the Photo, here are some ways you can do so
Text Link
photo Link
<span class="text-link">
<span>
<a target="_blank" href=https://pikwizard.com/photo/dynamic-financial-graph-with-violet-background-concept/166c88f2719d7850230b10068726f298/>PikWizard</a>
</span>
</span>
<span class="image-link">
<span
style="margin: 0 0 20px 0; display: inline-block; vertical-align: middle; width: 100%;"
>
<a
target="_blank"
href="https://pikwizard.com/photo/dynamic-financial-graph-with-violet-background-concept/166c88f2719d7850230b10068726f298/"
style="text-decoration: none; font-size: 10px; margin: 0;"
>
<img src="https://pikwizard.com/pw/medium/166c88f2719d7850230b10068726f298.jpg" style="margin: 0; width: 100%;" alt="" />
<p style="font-size: 12px; margin: 0;">PikWizard</p>
</a>
</span>
</span>
Free (free of charge)
Free for personal and commercial use.
Author: Awesome Content
Similar Free Stock Images

Premium


Premium


Premium


Premium


Premium


Premium


Premium


Premium


Premium


Premium


Premium


Premium


Premium


Premium


Premium


Premium


Premium


Premium


Premium


Premium


Premium


Premium


Premium


Premium

