- Home >
- Stock Photos >
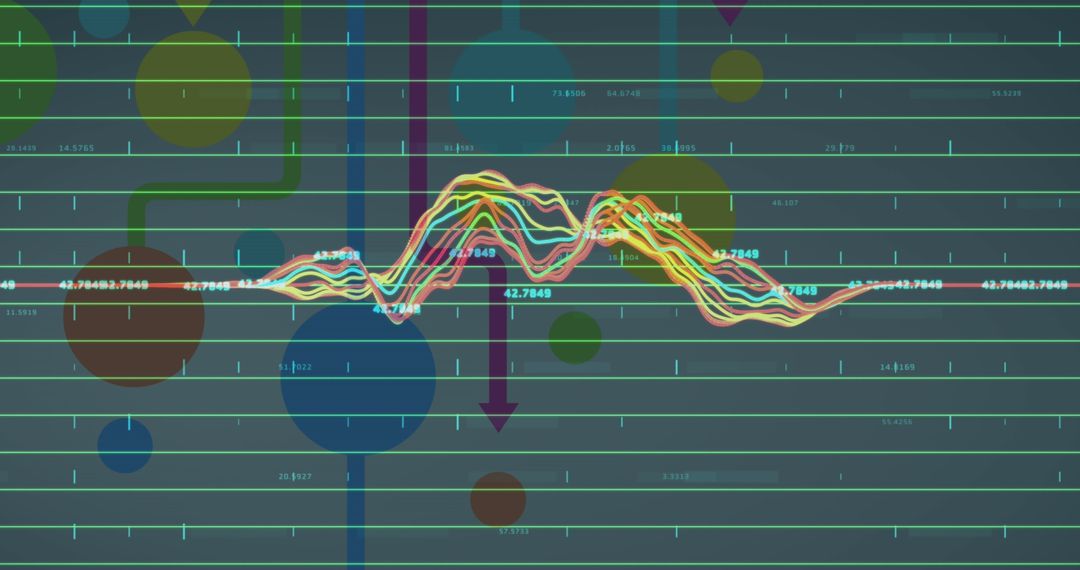
- Dynamic Financial Graphs and Charts on Black Background
Dynamic Financial Graphs and Charts on Black Background Image

Graphic features multiple colorful financial charts on a black background symbolizing the interconnected nature of global finance and technology. Useful for blogs, websites, or magazines discussing stock market analysis, financial planning, investment strategies, economic forecasts, and fintech innovations.
Powered by 


2
downloads
downloads
Tags:
More
Credit Photo
If you would like to credit the Photo, here are some ways you can do so
Text Link
photo Link
<span class="text-link">
<span>
<a target="_blank" href=https://pikwizard.com/photo/dynamic-financial-graphs-and-charts-on-black-background/d445b2ae41e78c4881696fd857167b32/>PikWizard</a>
</span>
</span>
<span class="image-link">
<span
style="margin: 0 0 20px 0; display: inline-block; vertical-align: middle; width: 100%;"
>
<a
target="_blank"
href="https://pikwizard.com/photo/dynamic-financial-graphs-and-charts-on-black-background/d445b2ae41e78c4881696fd857167b32/"
style="text-decoration: none; font-size: 10px; margin: 0;"
>
<img src="https://pikwizard.com/pw/medium/d445b2ae41e78c4881696fd857167b32.jpg" style="margin: 0; width: 100%;" alt="" />
<p style="font-size: 12px; margin: 0;">PikWizard</p>
</a>
</span>
</span>
Free (free of charge)
Free for personal and commercial use.
Author: Authentic Images
Similar Free Stock Images

Premium


Premium


Premium


Premium


Premium


Premium


Premium


Premium


Premium


Premium


Premium


Premium


Premium


Premium


Premium


Premium


Premium


Premium


Premium


Premium


Premium


Premium


Premium


Premium