- Home >
- Stock Photos >
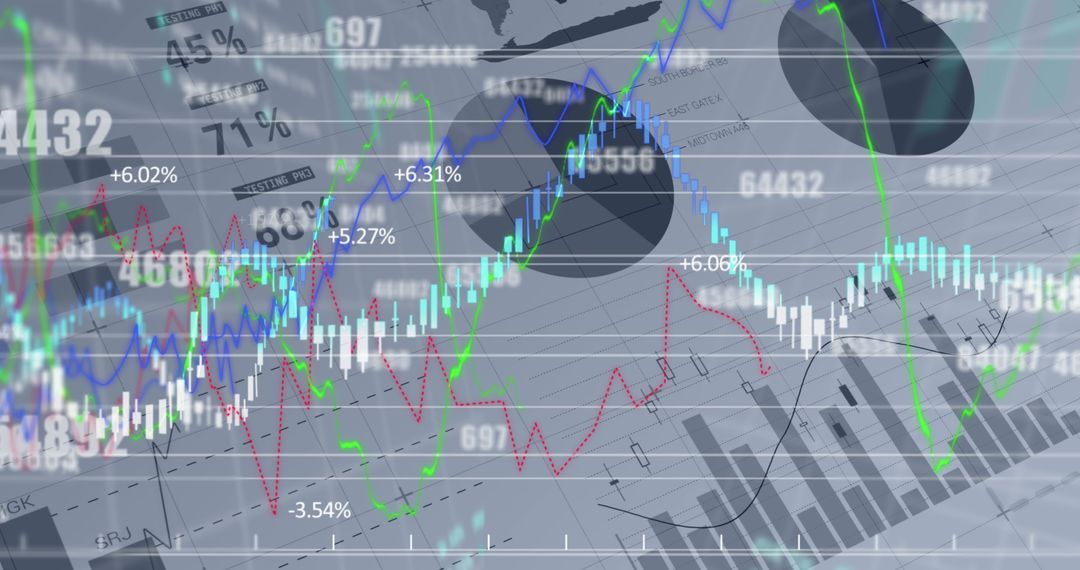
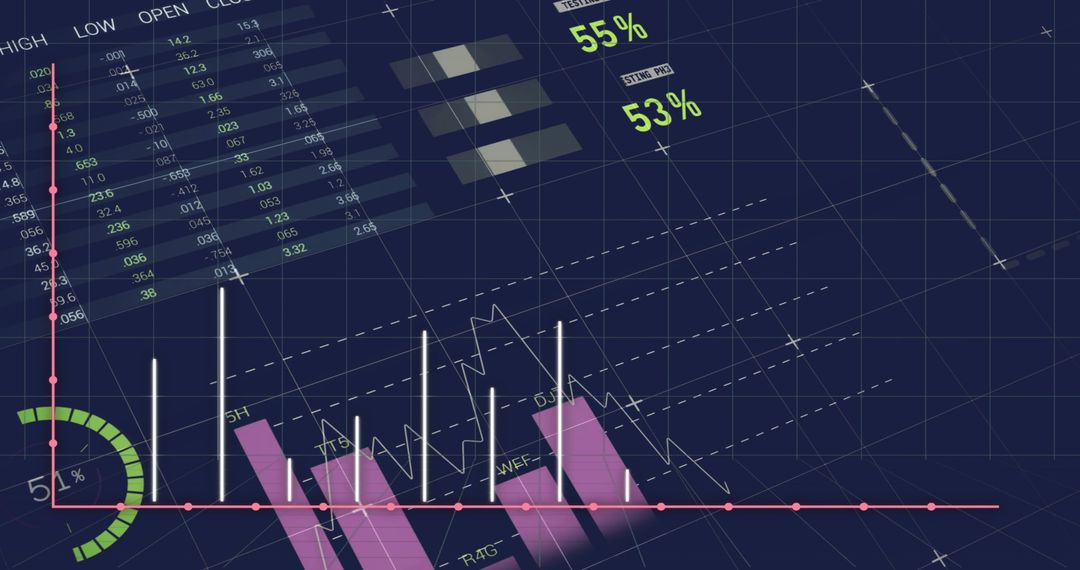
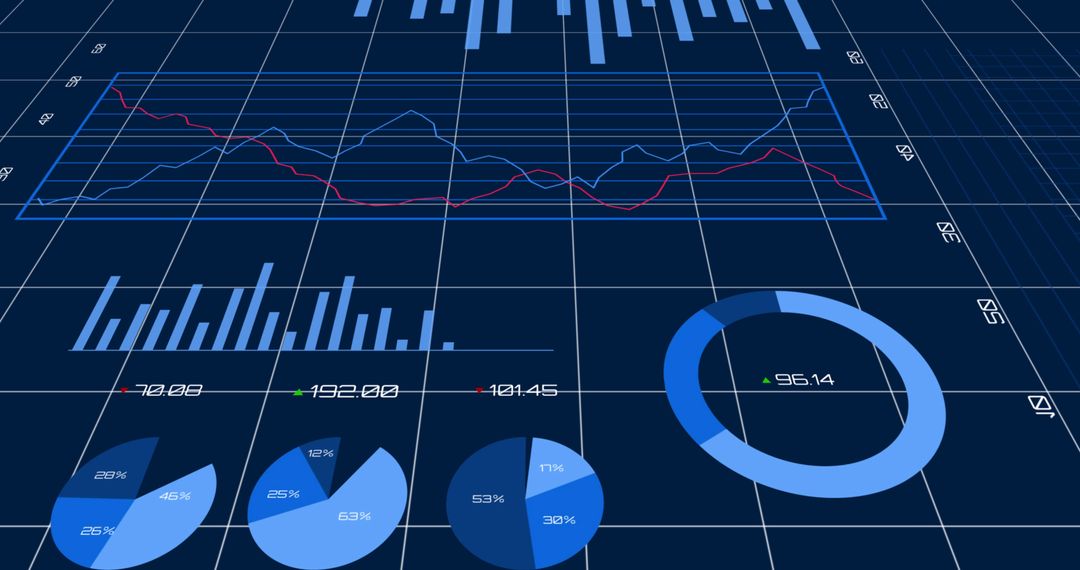
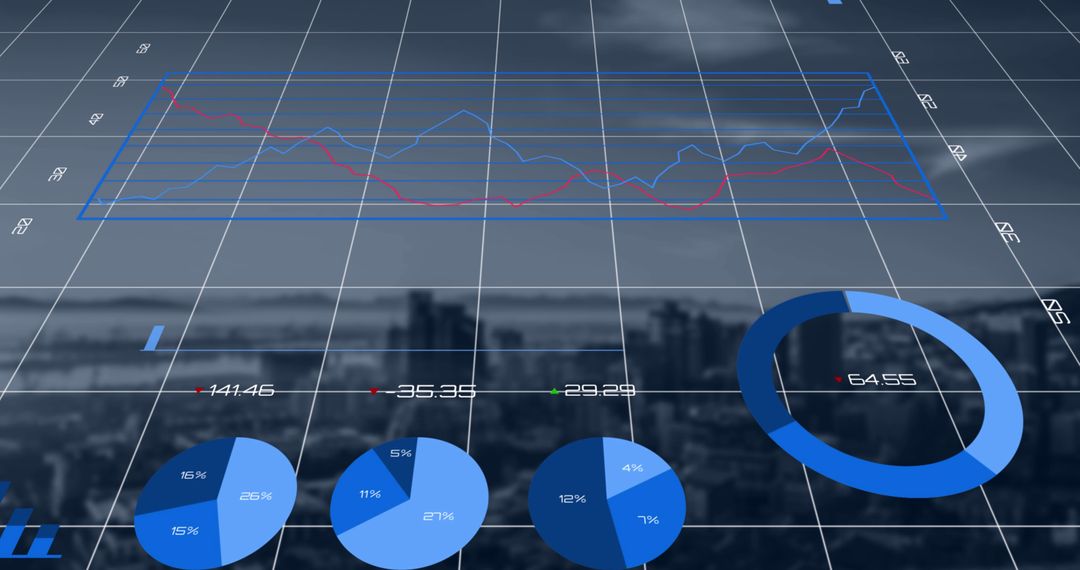
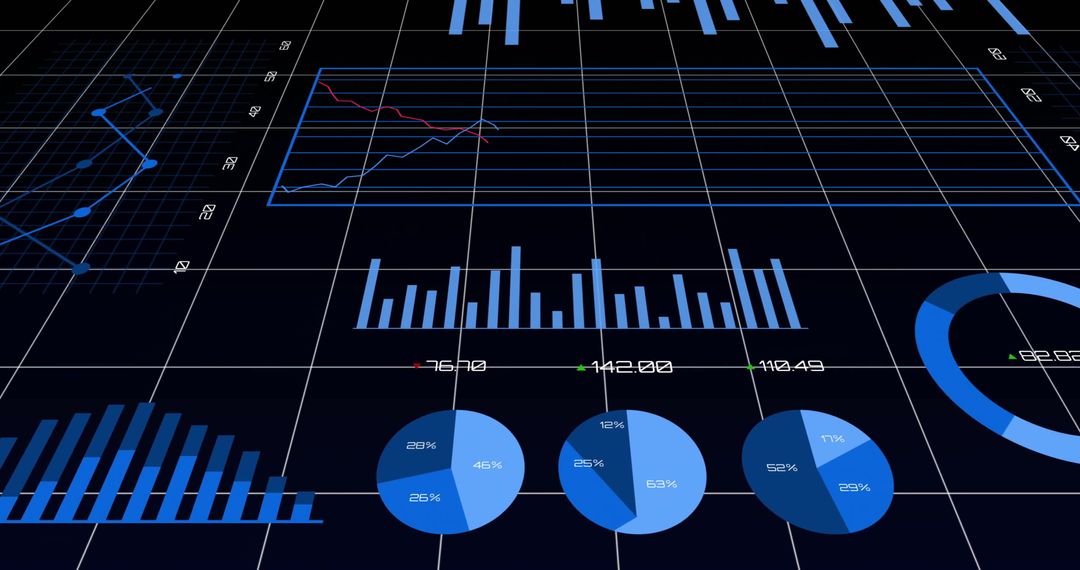
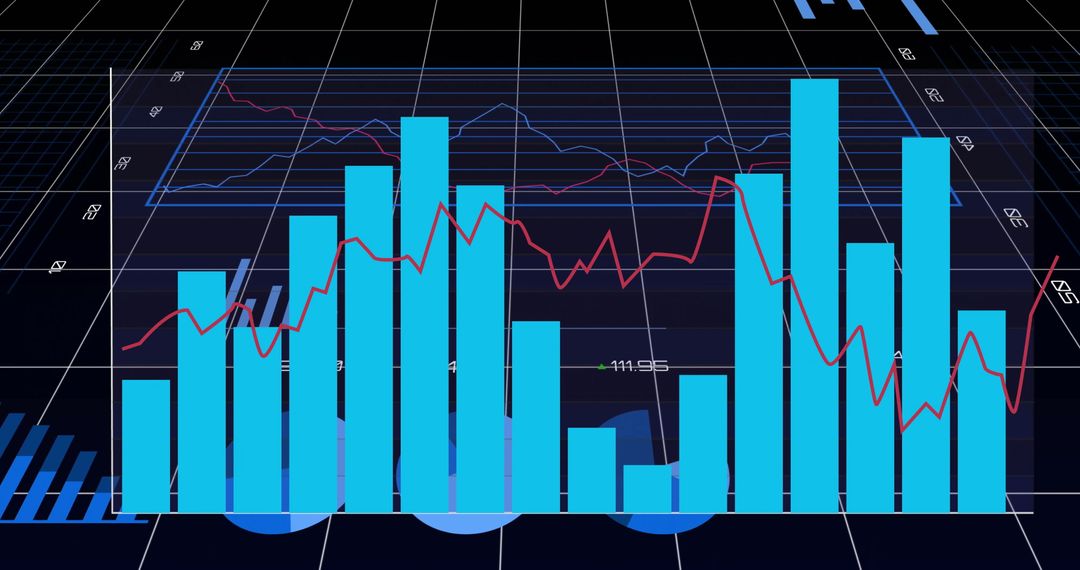
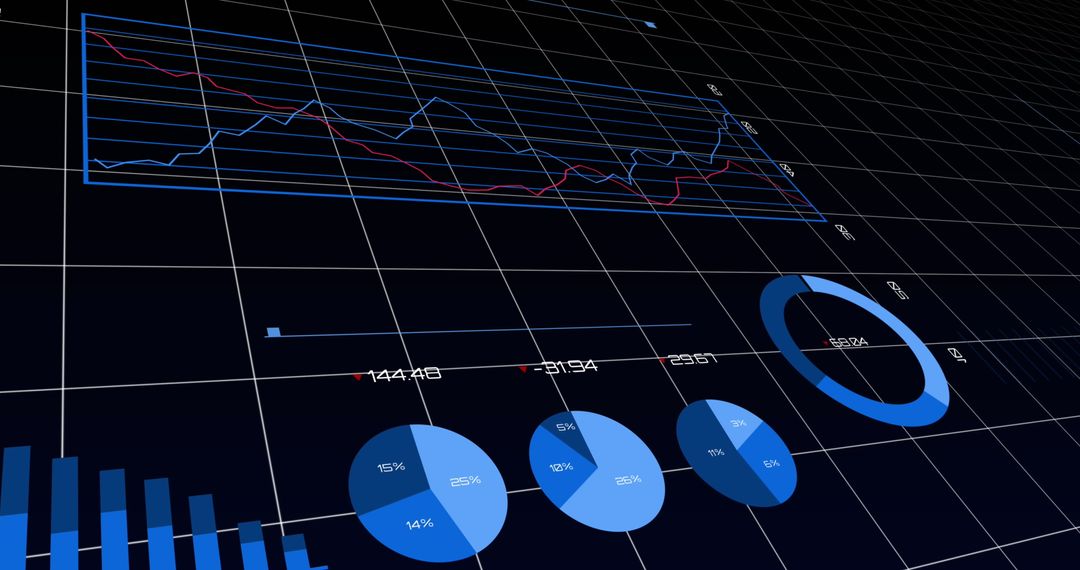
- Dynamic Financial Graphs and Charts on Digital Grid Display
Dynamic Financial Graphs and Charts on Digital Grid Display Image

This visually engaging illustration depicts various financial graphs, statistics, and charts on a digital grid. The sophisticated presentation includes line and pie charts, a donut chart, and numerical data against a high-tech background. Ideal for use in business presentations, financial reports, educational materials, or articles related to global markets, data analysis, and blockchain technology.
Powered by 


2
downloads
downloads
Tags:
More
Credit Photo
If you would like to credit the Photo, here are some ways you can do so
Text Link
photo Link
<span class="text-link">
<span>
<a target="_blank" href=https://pikwizard.com/photo/dynamic-financial-graphs-and-charts-on-digital-grid-display/d8a6092c5b32eabf93318c1b43874946/>PikWizard</a>
</span>
</span>
<span class="image-link">
<span
style="margin: 0 0 20px 0; display: inline-block; vertical-align: middle; width: 100%;"
>
<a
target="_blank"
href="https://pikwizard.com/photo/dynamic-financial-graphs-and-charts-on-digital-grid-display/d8a6092c5b32eabf93318c1b43874946/"
style="text-decoration: none; font-size: 10px; margin: 0;"
>
<img src="https://pikwizard.com/pw/medium/d8a6092c5b32eabf93318c1b43874946.jpg" style="margin: 0; width: 100%;" alt="" />
<p style="font-size: 12px; margin: 0;">PikWizard</p>
</a>
</span>
</span>
Free (free of charge)
Free for personal and commercial use.
Author: Awesome Content
Similar Free Stock Images

Premium


Premium


Premium


Premium


Premium


Premium


Premium


Premium


Premium


Premium


Premium


Premium


Premium


Premium


Premium


Premium


Premium


Premium


Premium


Premium


Premium


Premium


Premium


Premium