
- Home >
- Stock Photos >
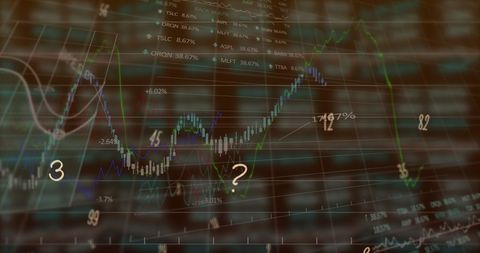
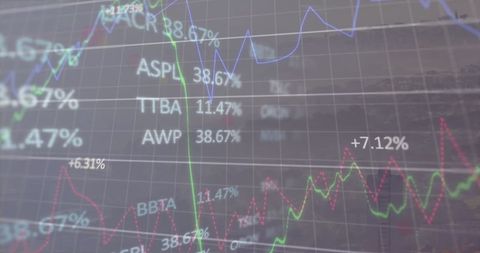
- Dynamic Financial Graphs and Data Fluctuations
Dynamic Financial Graphs and Data Fluctuations Image

Visual representation of fluctuating market trends with dynamic graphs. This can show concepts of financial growth, trading, investment strategy, and data analytics. Useful for illustrating articles on finance, economics, and trading success.
Powered by  - Get 15% off with code: PIKWIZARD15


downloads
Tags:
More
Credit Photo
If you would like to credit the Photo, here are some ways you can do so
Text Link
photo Link
<span class="text-link">
<span>
<a target="_blank" href=https://pikwizard.com/photo/dynamic-financial-graphs-and-data-fluctuations/deedf1091522a7c6dd415d1f295d3760/>PikWizard</a>
</span>
</span>
<span class="image-link">
<span
style="margin: 0 0 20px 0; display: inline-block; vertical-align: middle; width: 100%;"
>
<a
target="_blank"
href="https://pikwizard.com/photo/dynamic-financial-graphs-and-data-fluctuations/deedf1091522a7c6dd415d1f295d3760/"
style="text-decoration: none; font-size: 10px; margin: 0;"
>
<img src="https://pikwizard.com/pw/medium/deedf1091522a7c6dd415d1f295d3760.jpg" style="margin: 0; width: 100%;" alt="" />
<p style="font-size: 12px; margin: 0;">PikWizard</p>
</a>
</span>
</span>
Free (free of charge)
Free for personal and commercial use.
Author: Authentic Images
Similar Free Stock Images

Premium


Premium


Premium


Premium

Premium


Premium


Premium


Premium


Premium


Premium


Premium


Premium


Premium


Premium


Premium

Premium


Premium

Premium


Premium


Premium

Premium


Premium


Premium


Premium

Premium


Explore More Free Stock Images