- Home >
- Stock Photos >
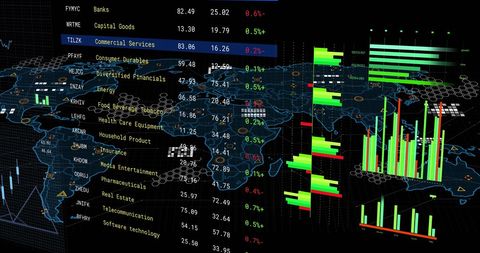
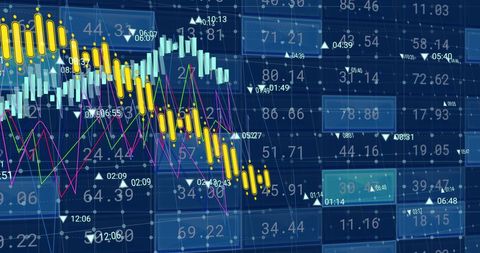
- Dynamic Financial Graphs and Data in Digital Abstract
Dynamic Financial Graphs and Data in Digital Abstract Image

Dynamic representation of financial data with numbers and graphs over abstract background. Useful for illustrating concepts in finance, business analytics, data processing, stock market trends, and economic research. Ideal for use in presentations, websites, and educational materials involving quantitative analysis or financial predictions.

downloads
Tags:
More
Credit Photo
If you would like to credit the Photo, here are some ways you can do so
Text Link
photo Link
<span class="text-link">
<span>
<a target="_blank" href=https://pikwizard.com/photo/dynamic-financial-graphs-and-data-in-digital-abstract/bec7bab9d8733f7cacef0def6d2b102a/>PikWizard</a>
</span>
</span>
<span class="image-link">
<span
style="margin: 0 0 20px 0; display: inline-block; vertical-align: middle; width: 100%;"
>
<a
target="_blank"
href="https://pikwizard.com/photo/dynamic-financial-graphs-and-data-in-digital-abstract/bec7bab9d8733f7cacef0def6d2b102a/"
style="text-decoration: none; font-size: 10px; margin: 0;"
>
<img src="https://pikwizard.com/pw/medium/bec7bab9d8733f7cacef0def6d2b102a.jpg" style="margin: 0; width: 100%;" alt="" />
<p style="font-size: 12px; margin: 0;">PikWizard</p>
</a>
</span>
</span>
Free (free of charge)
Free for personal and commercial use.
Author: Awesome Content