- Home >
- Stock Photos >
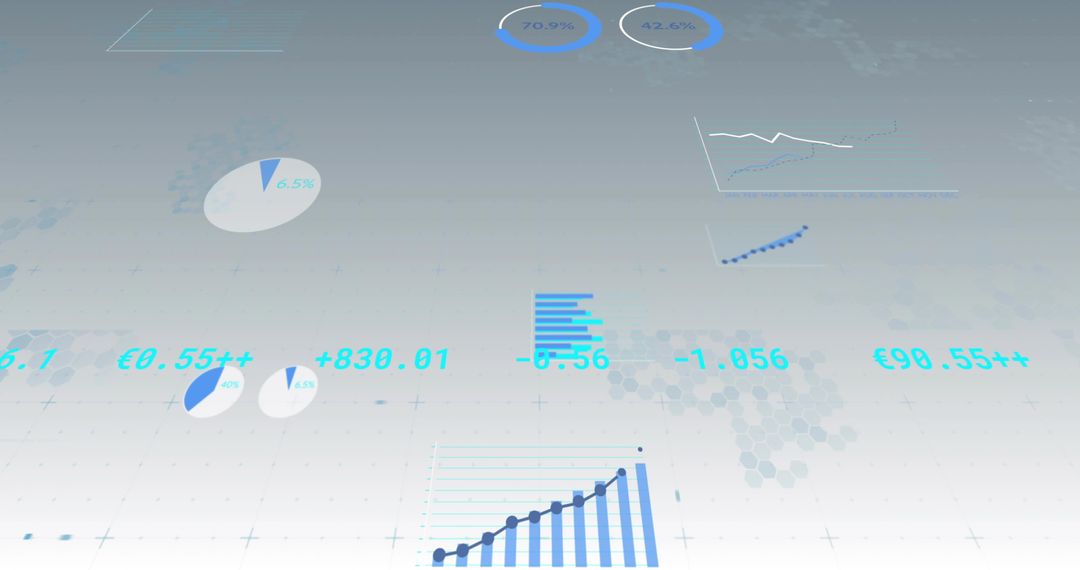
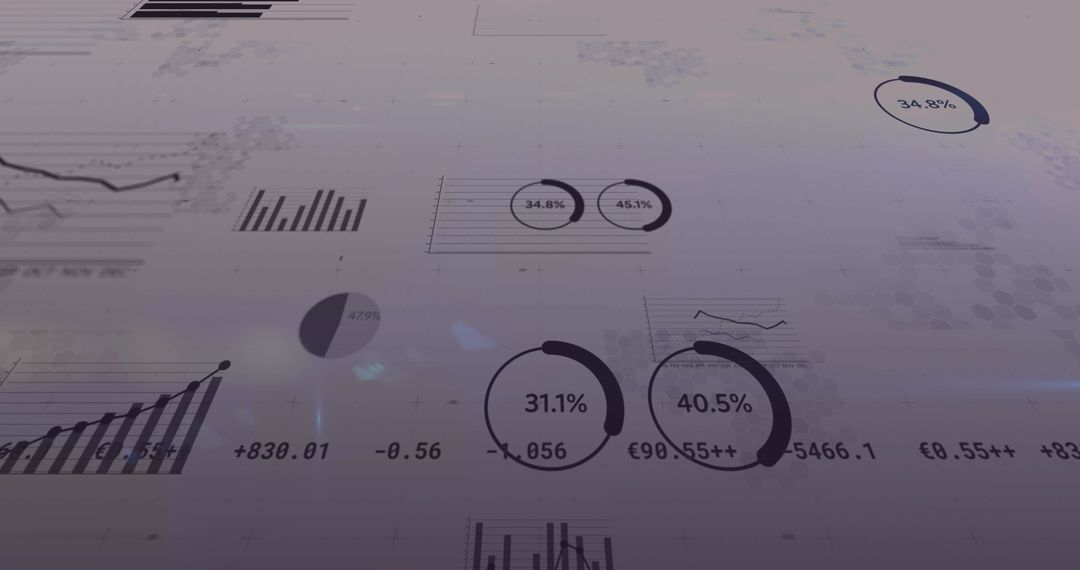
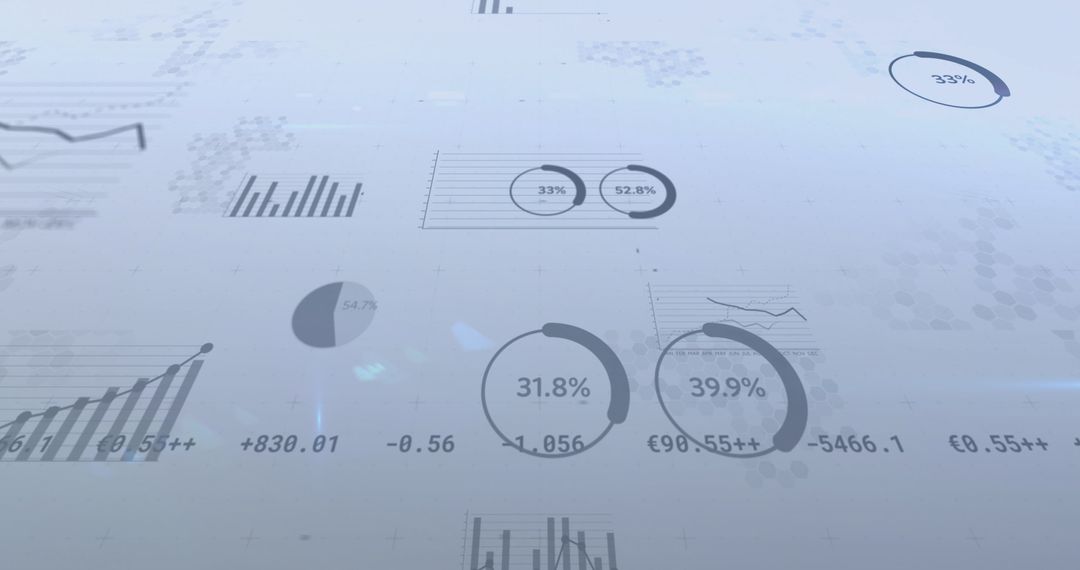
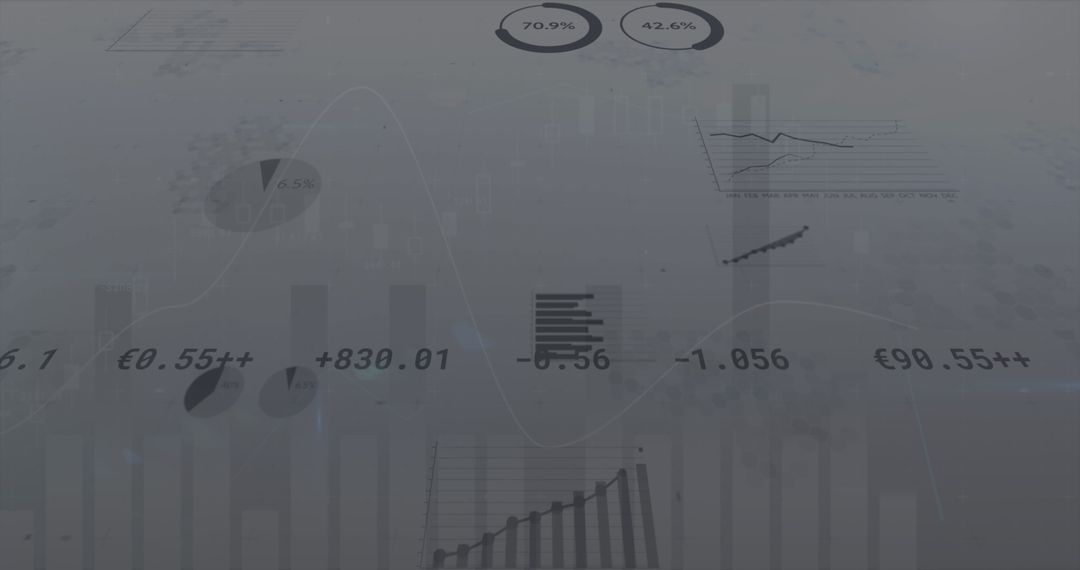
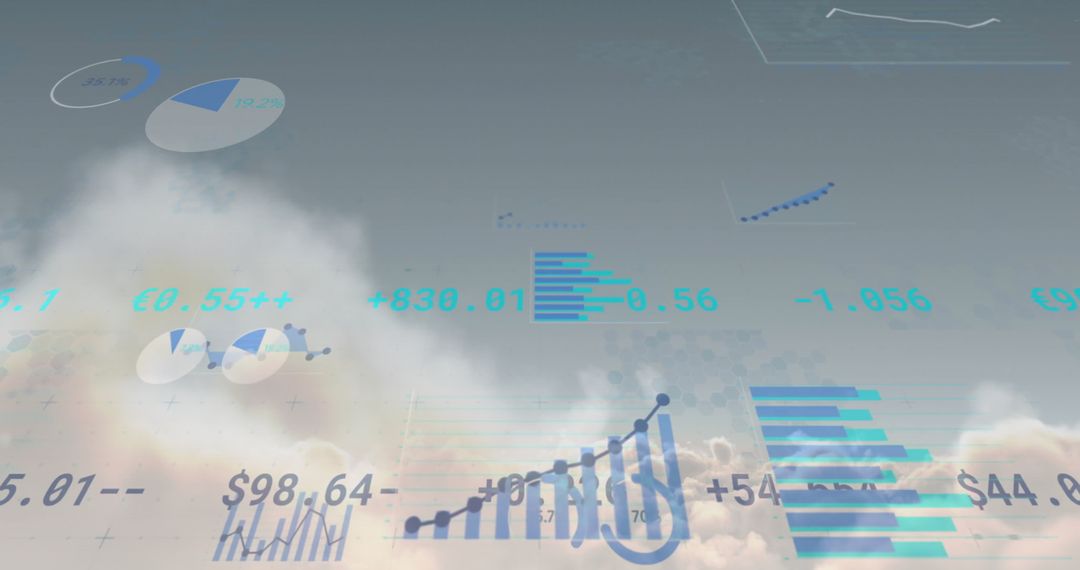
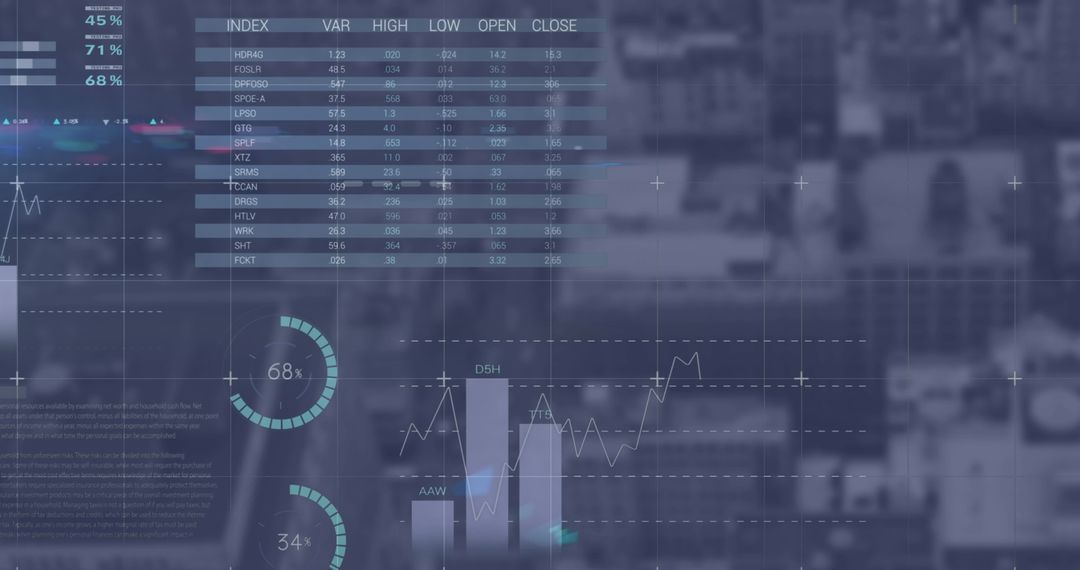
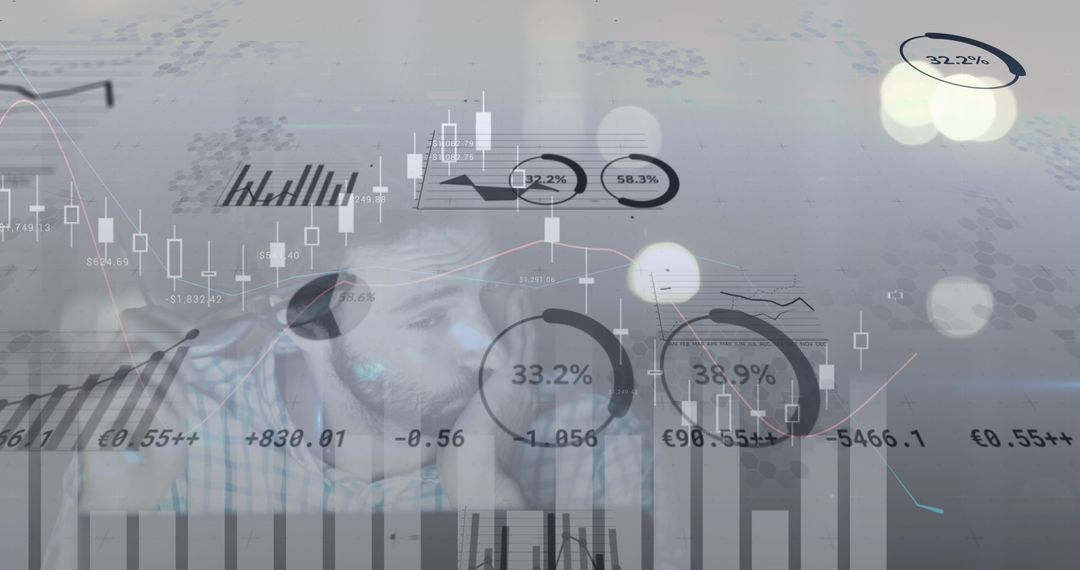
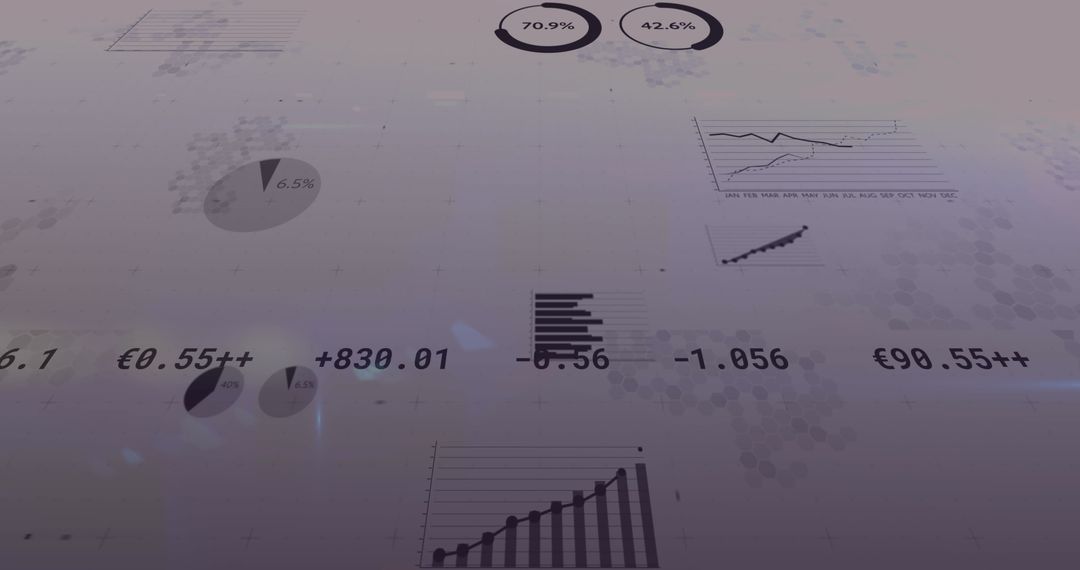
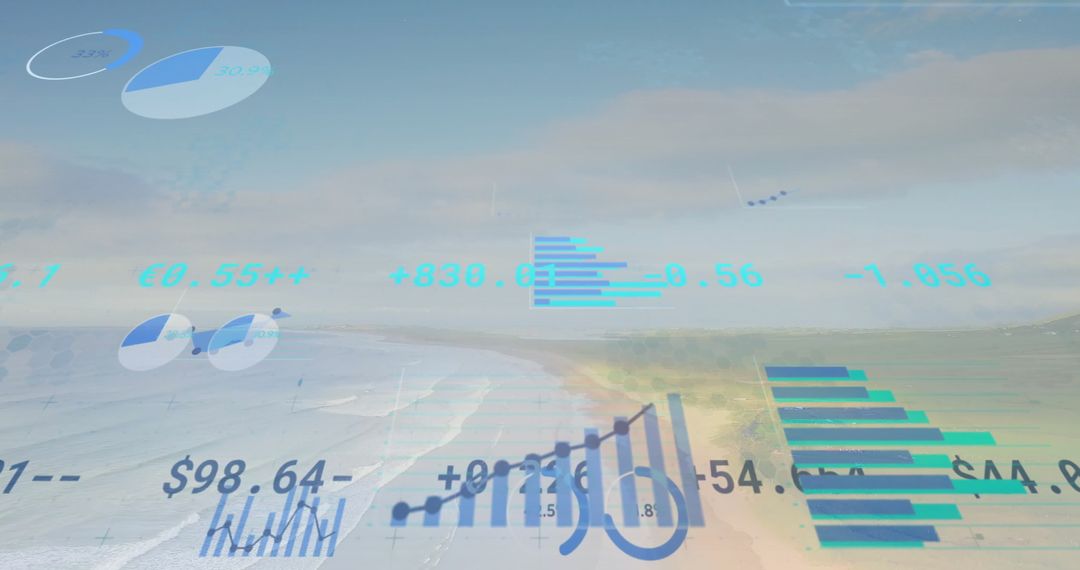
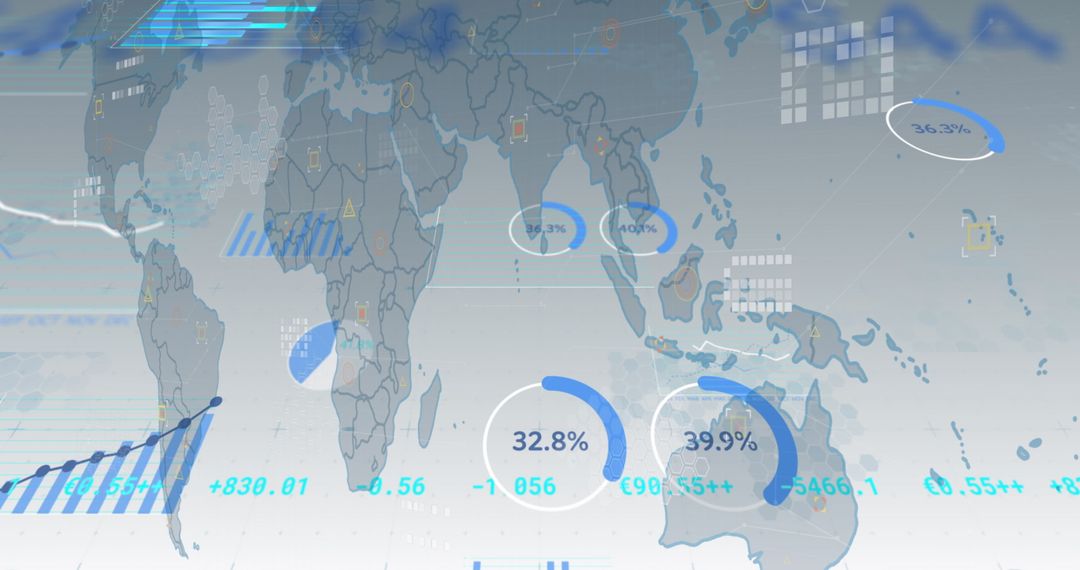
- Dynamic Financial Graphs and Numbers on Grey Background
Dynamic Financial Graphs and Numbers on Grey Background Image
The visual shows a variety of financial graphs, charts, and fluctuating numbers on a grey backdrop, illustrating concepts of global business, finance, and technological integration. This can be used in presentations focusing on modern economic trends, financial forecasting, digital analytics, or reports for understanding global economic conditions.
Powered by 


0
downloads
downloads
Tags:
More
Credit Photo
If you would like to credit the Photo, here are some ways you can do so
Text Link
photo Link
<span class="text-link">
<span>
<a target="_blank" href=https://pikwizard.com/photo/dynamic-financial-graphs-and-numbers-on-grey-background/2c23b6ce4026995b2830c86d8b6b5e2f/>PikWizard</a>
</span>
</span>
<span class="image-link">
<span
style="margin: 0 0 20px 0; display: inline-block; vertical-align: middle; width: 100%;"
>
<a
target="_blank"
href="https://pikwizard.com/photo/dynamic-financial-graphs-and-numbers-on-grey-background/2c23b6ce4026995b2830c86d8b6b5e2f/"
style="text-decoration: none; font-size: 10px; margin: 0;"
>
<img src="https://pikwizard.com/pw/medium/2c23b6ce4026995b2830c86d8b6b5e2f.jpg" style="margin: 0; width: 100%;" alt="" />
<p style="font-size: 12px; margin: 0;">PikWizard</p>
</a>
</span>
</span>
Free (free of charge)
Free for personal and commercial use.
Author: Awesome Content
Similar Free Stock Images
Premium


Premium


Premium


Premium


Premium


Premium


Premium


Premium


Premium


Premium


Premium


Premium


Premium


Premium


Premium


Premium


Premium


Premium


Premium

Premium


Premium


Premium


Premium


Premium