
- Home >
- Stock Photos >
- Dynamic Financial Graphs Displaying Market Trends
Dynamic Financial Graphs Displaying Market Trends Image

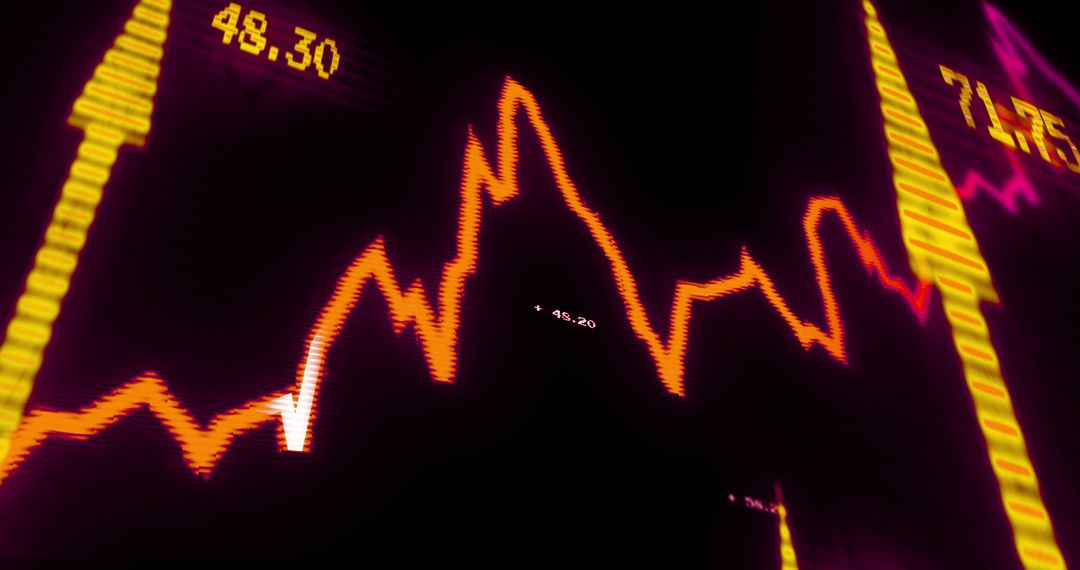
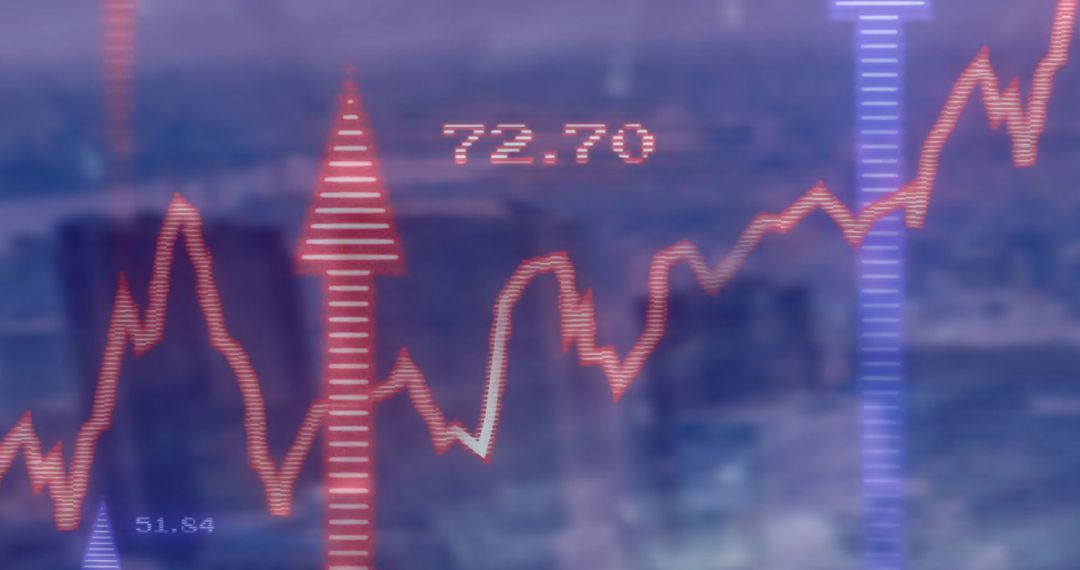
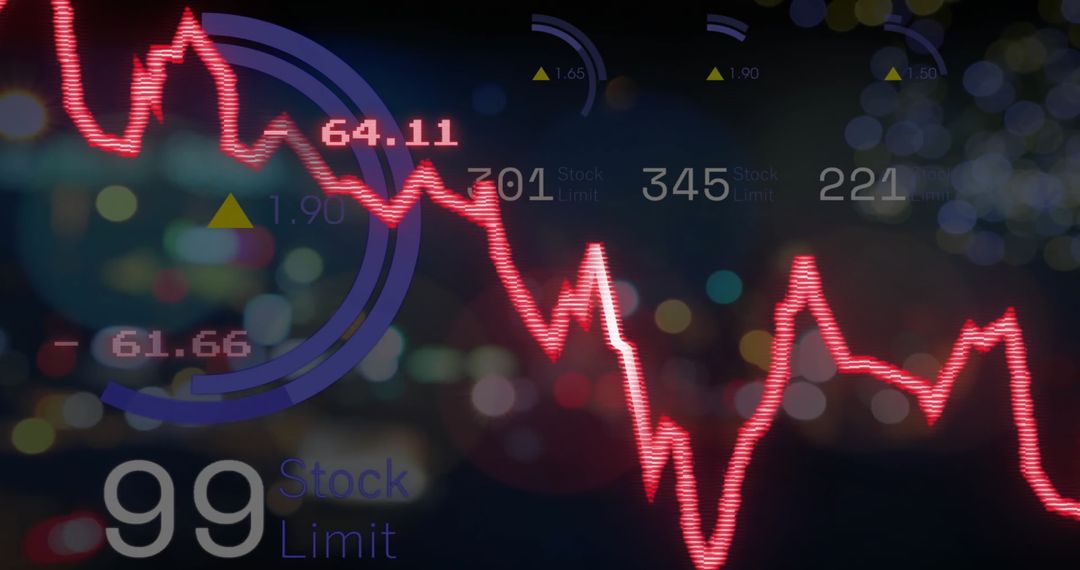
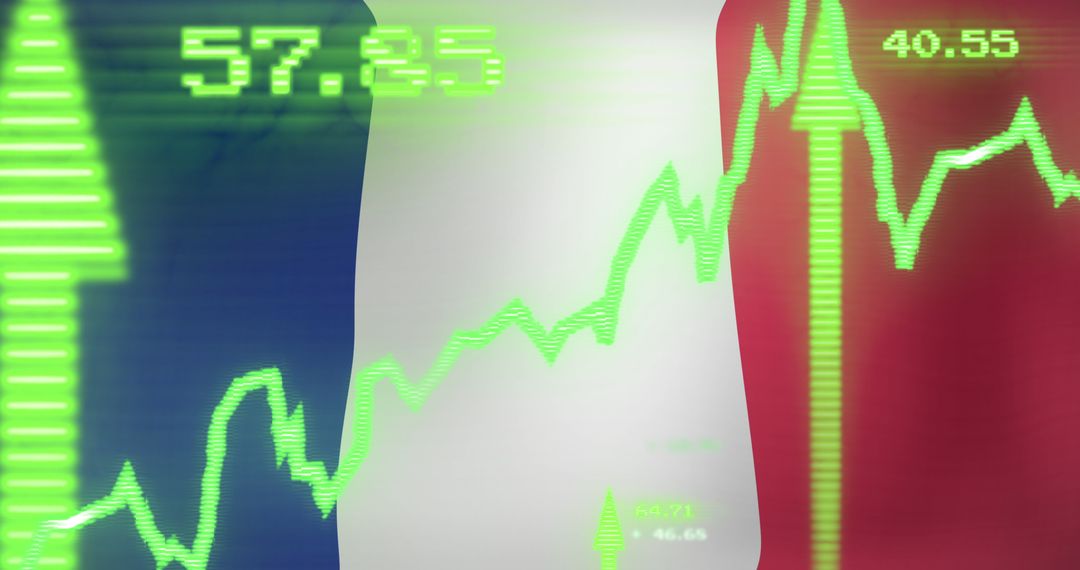
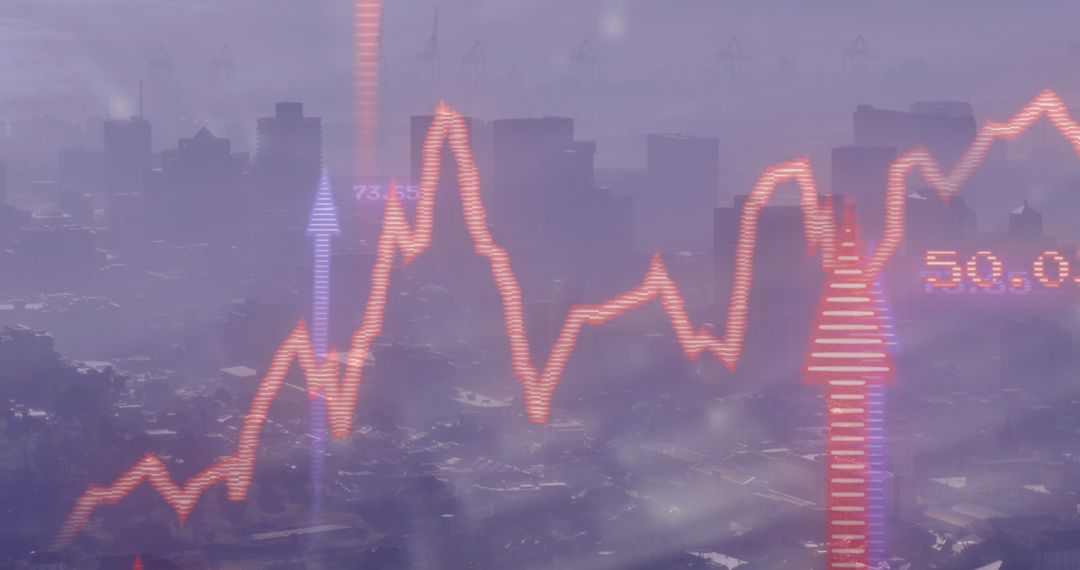
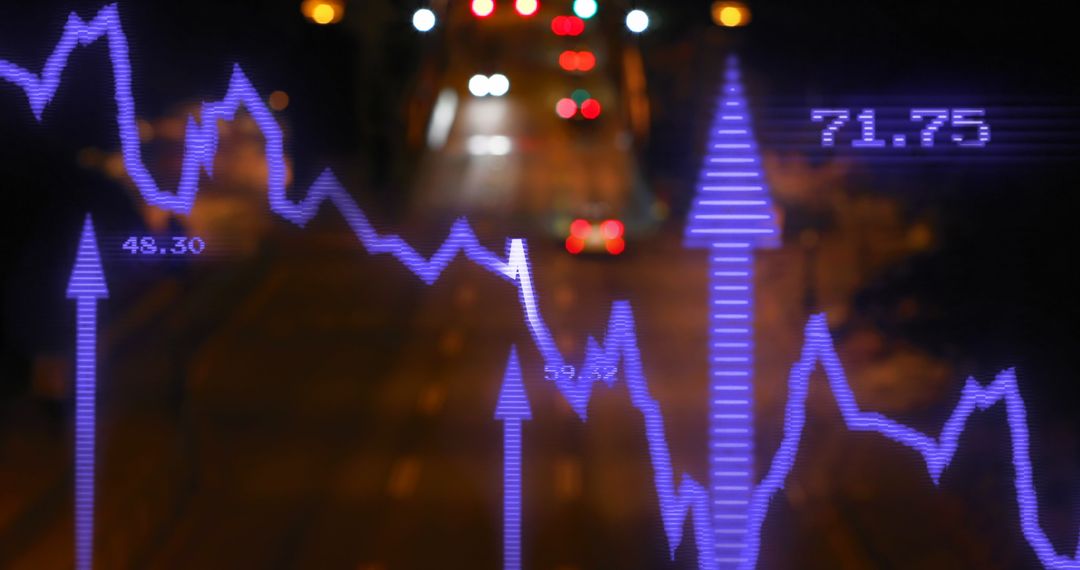
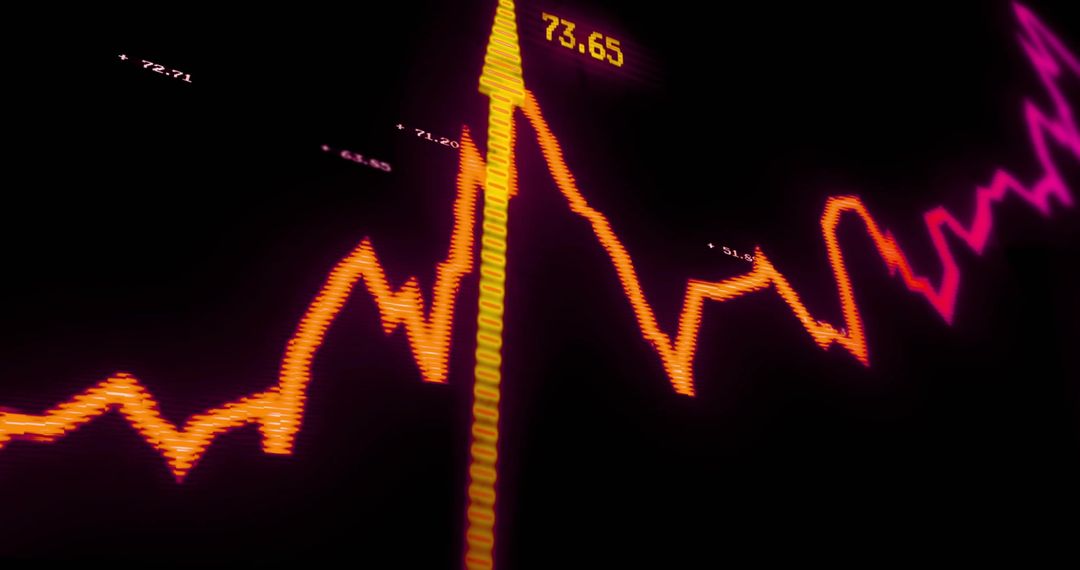
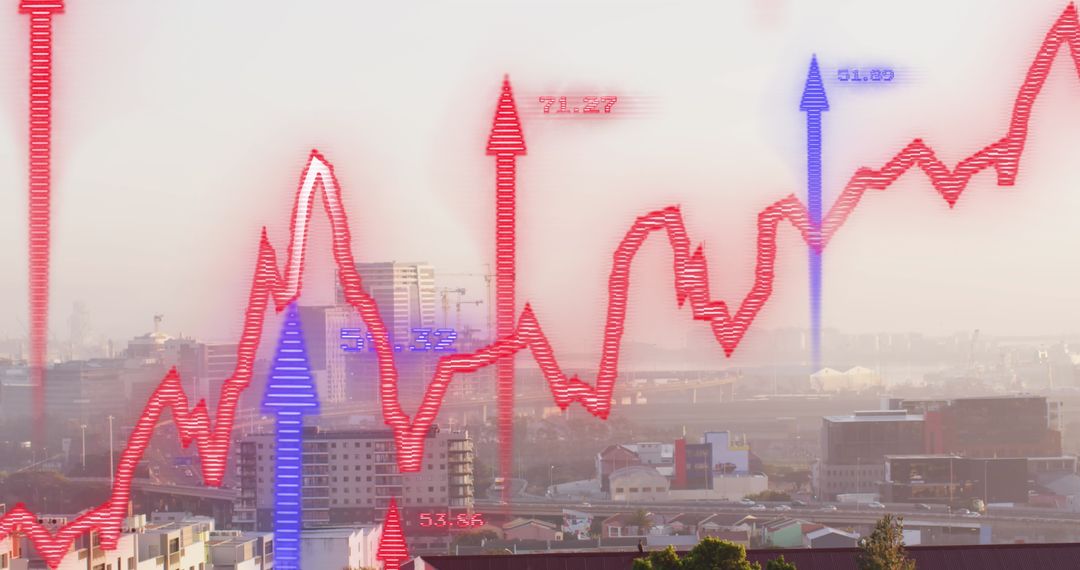
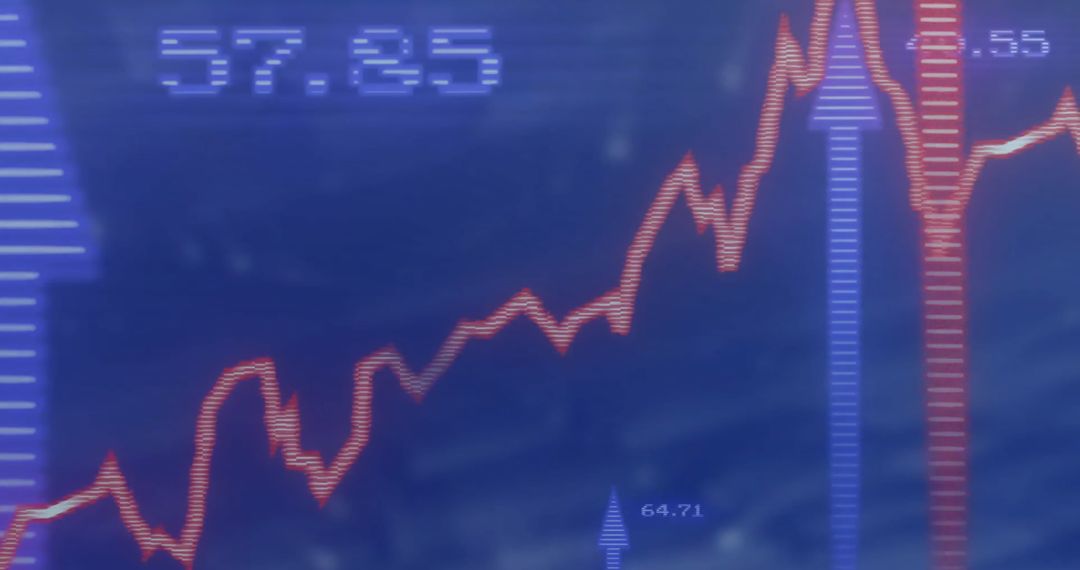
This image visualizing financial trends features ascending and descending arrows on a digital graph, symbolizing market movements and price fluctuations. Suitable for illustrating content related to economic analysis, trading strategies, financial reports, or presentations on market dynamics. Useful for business blogs, financial websites, and economic-focused articles.
Powered by  - Get 15% off with code: PIKWIZARD15


2
downloads
downloads
Tags:
More
Credit Photo
If you would like to credit the Photo, here are some ways you can do so
Text Link
photo Link
<span class="text-link">
<span>
<a target="_blank" href=https://pikwizard.com/photo/dynamic-financial-graphs-displaying-market-trends/0738a028cc5cf3f73d725649077ba7ab/>PikWizard</a>
</span>
</span>
<span class="image-link">
<span
style="margin: 0 0 20px 0; display: inline-block; vertical-align: middle; width: 100%;"
>
<a
target="_blank"
href="https://pikwizard.com/photo/dynamic-financial-graphs-displaying-market-trends/0738a028cc5cf3f73d725649077ba7ab/"
style="text-decoration: none; font-size: 10px; margin: 0;"
>
<img src="https://pikwizard.com/pw/medium/0738a028cc5cf3f73d725649077ba7ab.jpg" style="margin: 0; width: 100%;" alt="" />
<p style="font-size: 12px; margin: 0;">PikWizard</p>
</a>
</span>
</span>
Free (free of charge)
Free for personal and commercial use.
Author: Authentic Images
Similar Free Stock Images

Premium


Premium


Premium


Premium


Premium


Premium


Premium


Premium


Premium


Premium


Premium


Premium


Premium


Premium


Premium


Premium


Premium


Premium


Premium


Premium


Premium


Premium


Premium


Premium

